


Ordinals Price Prediction: This week, Bitcoin Ordinals(ORDIs) has emerged as a standout performer in the cryptocurrency market, with its price soaring from $4.92 to a current trading level of $19.2. This remarkable 327% gain was notably fueled on November 7th following the announcement by Binance, the largest cryptocurrency exchange, about listing the coin. This development catalyzed a significant capital inflow into ODRI, propelling it past key resistance levels.
Also Read: Bitcoin ETF Launch Will Precede Major Crash: Peter Schiff
Is ORDI Heading to $30?
- A recent breakout from the $18 barrier offers accelerate the bullish momentum,
- With Sustained buying, the ORDI price is poised for another 60% jump
- The intraday trading volume in Ordinals coin is $773 Million, indicating an 89% gain.
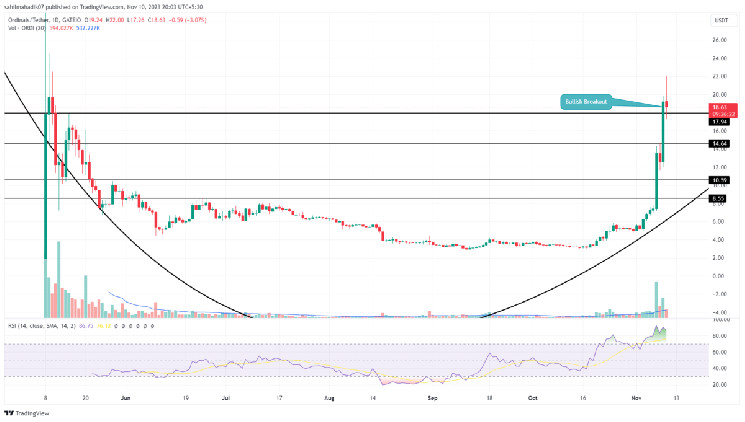
Source- Tradingview
On November 7th alone, the Ordinals coin experienced an 82% intraday surge, marking a bullish breakout from two pivotal swing highs at $8.55 and $10.5. This surge effectively ended a 5-month accumulation phase, signaling the start of a new recovery.
The daily timeframe chart now shows a parabolic growth pattern, indicative of a rounding bottom formation. This pattern is often seen as a strong indicator of a trend reversal, presenting a lucrative opportunity for long-term investors to capitalize on.
Recently, the coin breached yet another resistance at $18, setting a new target for buyers to propel the price even higher. By the press time, the ORDI price trades at $18.1, and with an intraday loss of 6%, it is retesting this breach resistance as a potential support.
Should the coin maintain stability at this level, we can anticipate a further upward trend, potentially reaching a 64% increase to the $29.5-$30 neckline resistance of the current pattern.
Key Levels to Watch
The current market outlook for Ordinals coin remains overwhelmingly bullish. However, should today’s closing price fall below the $18 mark, investors might witness a minor correction in the near term. Such pullbacks, following significant rallies, are often seen as healthy market corrections, allowing for a consolidation of the bullish sentiment. In the event of this pullback, potential support levels could be found at $14.6 and $10.6.
- Relative Strength Index: The daily RSI slope at 80% accentuates the aggressive bullish momentum and an overbought asset.
- Exponential Moving Average: In case of a bearish pullback, the 20-day EMA slope may offer some early support for buyers to sustain higher levels.
Read the full article here


 Signal, Bitcoin (BTC) Crucial $60,000 Resistance Reached")
 Cryptos Outshining This Week")


