

")


The Bitcoin price movement has been a point of contention among many crypto analysts, but almost everyone can agree that the way forward is up. One of these is a recent conversation regarding Bitcoin’s price pattern on social media platform X, with legendary trader Peter Brandt eventually providing his expertise to clear up the matter. According to Brandt, Bitcoin’s current price pattern is not that of a bull flag, which signals the continuation of an uptrend, but the crypto remains in a largely bullish sentiment.
Bitcoin Bull Flag Pattern?
Despite the various opinions, most analysts seem to agree that the long-term outlook for Bitcoin remains positive, with many believing that a surge is coming soon. Recently, a Bitcoin trader known as SilkoSpots on social media platform X shared a Bitcoin chart highlighting a bull flag pattern on BTC’s price action.
According to the trader, Bitcoin’s price formation has been that of a bull flag pattern since the beginning of the year. Particularly, the pole of the started in October 2023, and the flag has been in formation since Bitcoin’s all-time high in March 2024. As such, the crypto is only going through an extended period of consolidation, which is typical of a bull flag, before resuming the leg up.
However, not everyone agrees with this interpretation. Another crypto analyst, ColinTCrypto, raised concerns about the validity of this bull flag pattern. He referenced veteran trader Peter Brandt, who has been a long-standing authority in the field of technical analysis. Brandt’s key critique is that a bull flag cannot take such an extended period to develop.
According to Investopedia, bull flags usually resolve one way or the other in less than three weeks. If the price action drags on for longer, it often transforms into a different pattern, such as a rectangle or triangle.
Peter Brandt, echoing his previous insights, reaffirmed that a legitimate bull flag pattern cannot extend over such a long period. Nevertheless, Brandt noted that “a bear channel, once violated, could resume a longer-term bull trend.” Consequently, it would seem Brandt also believes Bitcoin is on its way to starting another uptrend.
What’s Next For BTC?
Bitcoin appears to be experiencing a temporary hiatus after a significant rally that saw its price climb 22% from a low of $52,825 on September 6 to $64630 on September 25. According to a chart analysis by Peter Brandt, BTC has largely been in an expanding triangle for the past six months with a series of lower highs and lower lows.

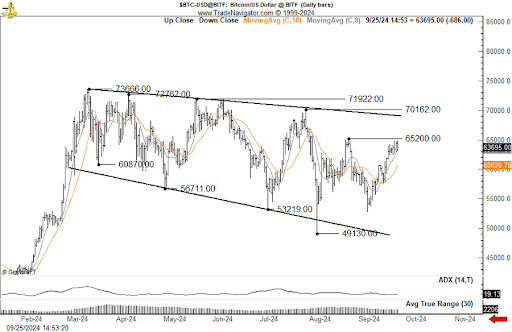
On a long-term basis, Bitcoin needs to close above the July high of $70,162 in order to complete this pattern and resume a full-blown uptrend. At the time of writing, BTC is trading at $63,780, around 10% away from this price point.


Featured image created with Dall.E, chart from Tradingview.com
Read the full article here


