


RAND TALKING POINTS & ANALYSIS
- Rand unable to capitalize on US initial jobless claims data.
- Fed officials to relate recent US economic data.
- Bullish divergence at trendline support could see some SUD upside to come.
USD/ZAR FUNDAMENTAL BACKDROP
Macro-economic fundamentals underpin almost all markets in the global economy via growth, inflation and employment – Get you FREE guide now!
Foundational Trading Knowledge
Macro Fundamentals
Recommended by Warren Venketas
The South African rand has reached a key juncture after appreciating against the US dollar post US CPI and PPI while finding support locally through South African retail sales data. Chinese optimism has gained tractions supplementing the ZAR via retail sales and industrial production figures while the Xi-Biden meeting seems to off to a positive start assisting riskier currencies like the rand.
Locally, a recent Harvard report was published highlighting plaguing problems facing a struggling economy. State capacity was a dominant theme and a root of many of the country’s challenges.
Jobless claims data increased marginally and beat forecasts but had minimal impact on the greenback.
The day ahead is US focused with Federal Reserve speakers scattered throughout. Their response to the recent misses on both CPI and PPI will closely watched particularly after Fed Chair Jerome Powell warned of easing monetary policy too quickly. The manner in which the Fed responds going forward is crucial as the Fed credibility comes into question should the path forward change from recent messaging from Mr. Powell.
USD/ZAR ECONOMIC CALENDAR (GMT +02:00)
Source: DailyFX Economic Calendar
Want to stay updated with the most relevant trading information? Sign up for our bi-weekly newsletter and keep abreast of the latest market moving events!
Trade Smarter – Sign up for the DailyFX Newsletter
Receive timely and compelling market commentary from the DailyFX team
Subscribe to Newsletter
TECHNICAL ANALYSIS
USD/ZAR DAILY CHART
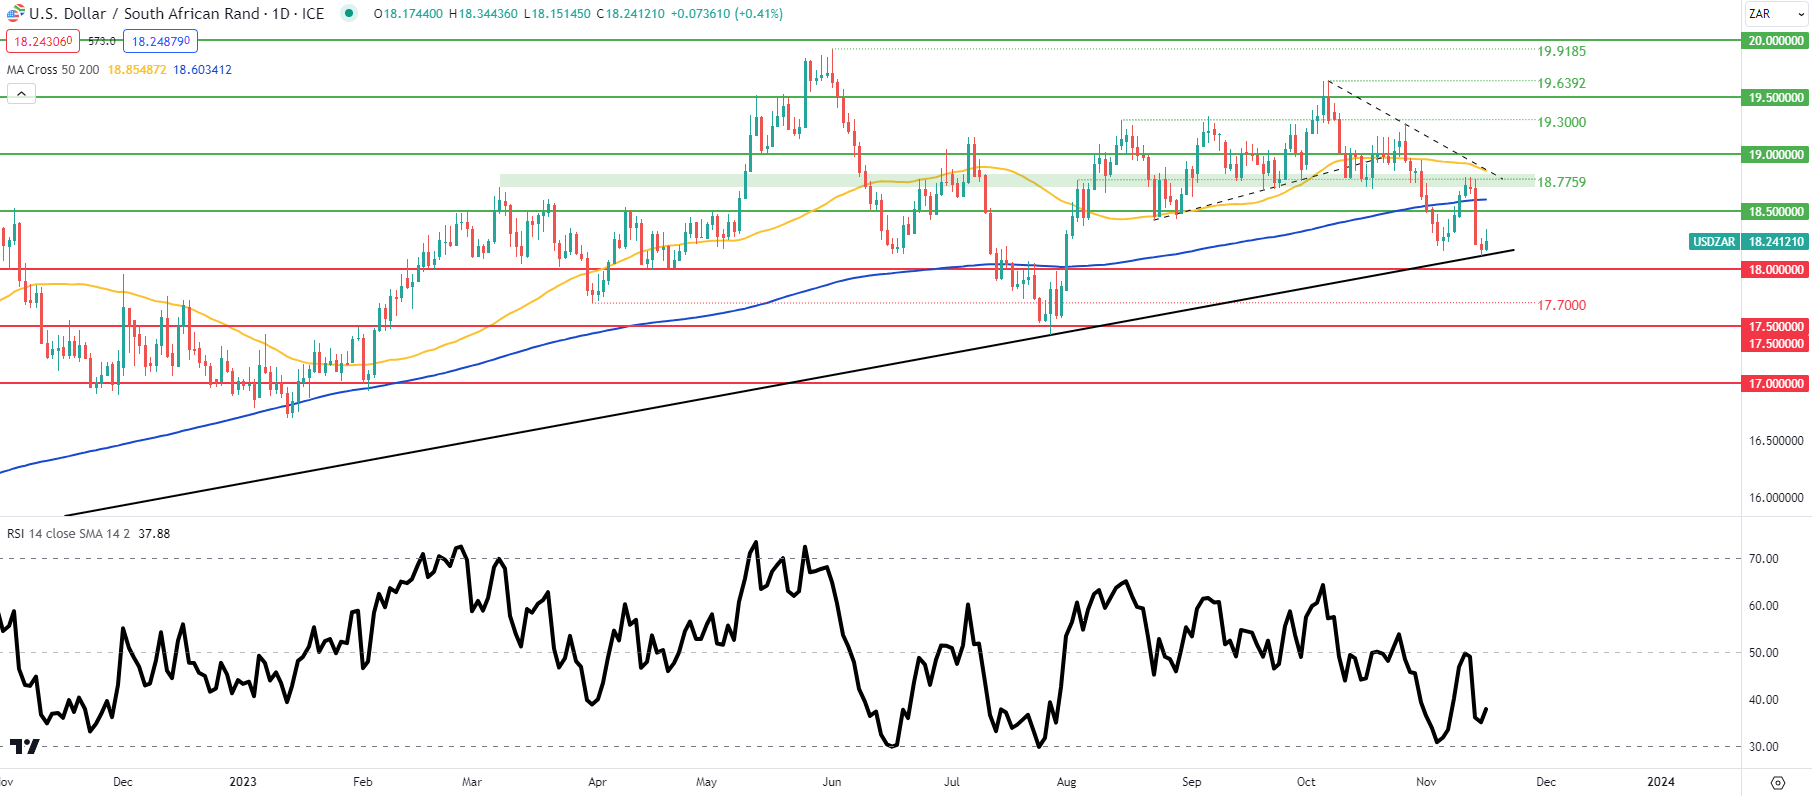

Chart prepared by Warren Venketas, TradingView
The daily USD/ZAR chart as mentioned in the title of this article is testing the long-term trendline support (black) that stemmed from late March 2022. A confirmation close below this zone particularly on the weekly chart could spark a further decline. Interestingly. the Relative Strength Index (RSI) is printing higher lows suggestive of bullish/positive divergence that could point to yet another push off support.
Resistance levels:
Support levels:
- Trendline support
- 18.0000
- 17.7000
Contact and followWarrenon Twitter:@WVenketas
Read the full article here


