RAND TALKING POINTS & ANALYSIS
- US specific factors drive ZAR strength but may be short-lived as markets may over overreacted to Friday’s NFP data.
- Fed speak in focus later today.
- USD/ZAR bulls keenly await possible short-term reversal.
USD/ZAR FUNDAMENTAL BACKDROP
Macro-economic fundamentals underpin almost all markets in the global economy via growth, inflation and employment – Get you FREE guide now!
Recommended by Warren Venketas
Get Your Free USD Forecast
The South African rand has managed to capitalize alongside its Emerging Market (EM) counterparts post-Non-Farm Payroll (NFP) last week Friday. Many market experts are more inclined into thinking that the Federal Reserve has now reached its peak. The weaker US dollar has given rise to many dollar-based commodities including major South African exports, thus providing sustenance for the local ZAR.
Optimism in China after recent growth statistics could be suggestive that stimulus measures by the government may be penetrating the market and strengthening the overall economy – net positive for the rand.
From a South African perspective, enhanced production capacity from Eskom has allowed for easing loadshedding conditions and could stoke investor optimism should this trend continue.
Today’s economic calendar shows a muted trading day with just the Fed’s Cook scheduled to speak (see below).
USD/ZAR ECONOMIC CALENDAR (GMT +02:00)
Source: DailyFX Economic Calendar
Want to stay updated with the most relevant trading information? Sign up for our bi-weekly newsletter and keep abreast of the latest market moving events!
Trade Smarter – Sign up for the DailyFX Newsletter
Receive timely and compelling market commentary from the DailyFX team
Subscribe to Newsletter
TECHNICAL ANALYSIS
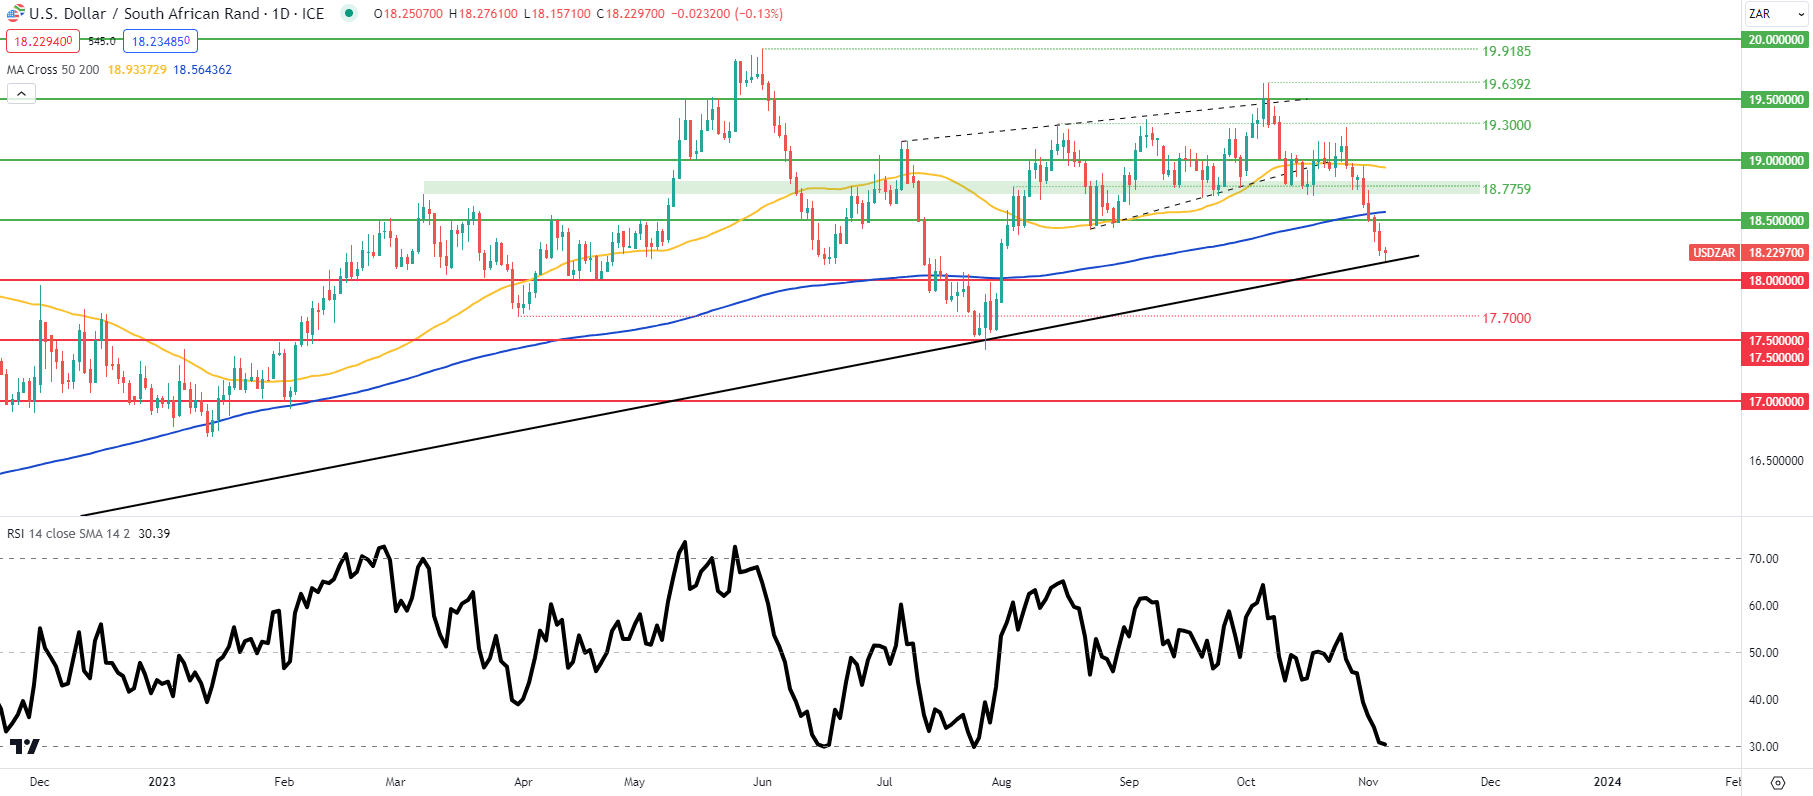
USD/ZAR DAILY CHART

Chart prepared by Warren Venketas, TradingView
The daily USD/ZAR chart above shows price action testing the key long-term trendline support (black) beginning in March 2022. This zone has held after multiple tests by bears and with the Relative Strength Index (RSI) in and around oversold territory, history may repeat itself. The long lower wick currently forming could supplement this view short-term.
Resistance levels:
- 19.0000
- 50-day MA
- 18.7759
- 200-day MA
- 18.5000
Support levels:
Contact and followWarrenon Twitter:@WVenketas
Read the full article here
