US DOLLAR FORECAST – EUR/USD, USD/JPY, GBP/USD
- The U.S. dollar has fallen sharply in recent weeks
- The greenback’s bearish correction may extend if November U.S. job data surprises to the downside
- This article examines the technical outlook for the major U.S. dollar pairs, analyzing critical price levels that could be relevant for EUR/USD, USD/JPY and GBP/USD
Trade Smarter – Sign up for the DailyFX Newsletter
Receive timely and compelling market commentary from the DailyFX team
Subscribe to Newsletter
Most Read: US Dollar Up but Bearish Risks Grow, Setups on EUR/USD, GBP/USD
The U.S. dollar, as measured by the DXY index, fell nearly 3% in November, weighed down by the downward correction in U.S. yields triggered by bets that the Federal Reserve has finished raising borrowing costs and would move to sharply reduce them in 2024 as part of a strategy to prevent a hard landing.
While some Fed officials have been dismissive of the idea of aggressive rate cuts in the near future, others have not entirely ruled out the possibility. Despite some mixed messages, policymakers have been unequivocal about one aspect: they’ll rely on the totality of data to guide their decisions.
Given the Fed’s high sensitivity to incoming information, the November U.S. employment report, due for release next Friday, will take on added significance and play a critical role in the formulation of monetary policy at upcoming meetings.
In terms of estimates, non-farm payrolls (NFP) are expected to have grown by 170,000 last month, following an increase of 150,000 in October, resulting in an unchanged unemployment rate of 3.9%. For its part, average hourly earnings are seen rising 0.3% m-o-m, with the related yearly reading easing to 4.0% from 4.1% previously.
Unsure about the U.S. dollar’s trend? Gain clarity with our Q4 forecast. Download a free copy of the guide now!
Recommended by Diego Colman
Get Your Free USD Forecast
UPCOMING US ECONOMIC REPORTS
Source: DailyFX Economic Calendars
With U.S. inflation evolving favorably and recent readings moving in the right direction, policymakers will have cover to start ditching the tough talk in favor of a more tempered stance soon. However, for this to happen, upcoming data will have to cooperate and reveal economic weakness.
We will have a better chance to assess the broader outlook and health of the economy in the coming days when the next NFP survey is out. In the grand scheme of things, job growth above 250,000 will likely be bullish for the U.S. dollar, whereas anything below 100,000 could reinforce the currency’s recent weakness. Meanwhile, any headline figure around 170,000 should be neutral to mildly supportive of the greenback.
For a comprehensive analysis of the euro’s medium-term prospects, request a copy of our latest forecast!
Recommended by Diego Colman
Get Your Free EUR Forecast
EUR/USD TECHNICAL ANALYSIS
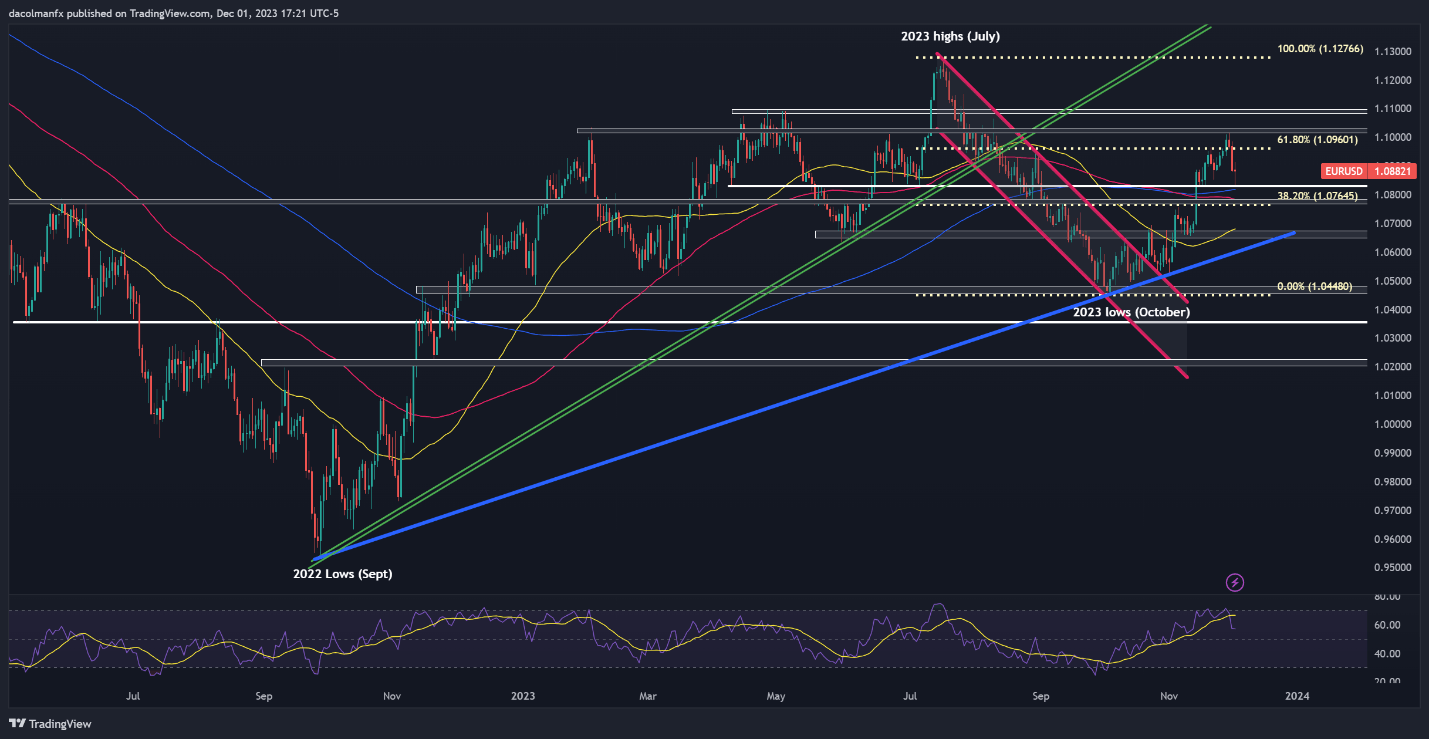
EUR/USD pulled back late in the past week, yet its bearish slide eased upon reaching a support zone close to 1.0830. If this technical floor holds, bulls could be emboldened to reload, paving the way for a rally toward Fibonacci resistance at 1.0960. On continued strength, a revisit to November’s high is probable, followed by a move towards horizontal resistance at 1.1080 upon a breakout.
On the flip side, if sentiment shifts in favor of sellers decisively and the pair accelerates its descent, support stretches from 1.0830 to 1.0815, a key range where the 200-day simple moving average is currently situated. Moving lower, market attention shifts to 1.0765, with a potential retreat towards 1.0650 likely upon invalidation of the aforementioned threshold.
EUR/USD TECHNICAL CHART

EUR/USD Chart Created Using TradingView
Interested in learning how retail positioning can give clues about the short-term trajectory of USD/JPY? Our sentiment guide has all the answers you are looking for. Get a free copy now!
| Change in | Longs | Shorts | OI |
| Daily | -4% | -3% | -4% |
| Weekly | 9% | -17% | -11% |
USD/JPY TECHNICAL ANALYSIS
USD/JPY has been down on its luck in recent weeks, dragged down by the broader U.S. dollar’s downward correction. Heading into the weekend, the pair took a turn to the downside, slipping below the 100-day moving average. If the breakdown holds, prices could slide towards channel support at 146.00. On continued softness, a drop towards 144.50 should not be ruled out.
In the scenario of a bullish turnaround, the first technical resistance that could hinder upward movements appears at 149.70. Surpassing this ceiling could pose a challenge for the bulls; however, a topside breakout is likely to ignite a rally towards 150.90, potentially culminating in a retest of this year’s peak located around the 152.00 handle.
USD/JPY TECHNICAL CHART
USD/JPY Chart Created Using TradingView
Stay ahead of the curve! Claim your complimentary GBP/USD trading forecast for a thorough overview of the British pound’s technical and fundamental outlook
Recommended by Diego Colman
Get Your Free GBP Forecast
GBP/USD TECHNICAL ANALYSIS
GBP/USD has risen sharply over the past three weeks, logging solid gains that have coincided with a shift in favor of riskier currencies at the expense of the broader U.S. dollar. After recent price developments, cable is flirting with overhead resistance at 1.2720, defined by the 61.8% Fib retracement of the July/October selloff. If the bulls manage to clear this ceiling, a rally potentially exceeding 1.2800 might unfold.
Conversely, if bullish impetus fades and sellers start to regain the upper hand, we may see a retrenchment towards 1.2590. GBP/USD could stabilize around this technical floor on a pullback before resuming its advance, but a break below the region could intensify bearish pressure, opening the door for a decline towards trendline support and the 200-day moving average slightly above 1.2460.
GBP/USD TECHNICAL CHART
GBP/USD Chart Created Using TradingView
Read the full article here

