

 found support at the blue box area")
 Explodes to a One-Month High as Most Investors Turn Profitable")


TASI Index Elliott Wave Analysis: Daily Chart
TASI index Elliott Wave technical analysis
Function: Bullish Trend.
Mode: Impulsive.
Structure: Gray Wave 3.
Position: Orange Wave 3.
Next lower degrees direction: Gray Wave 4.
Details: Gray Wave 2 completed, now Gray Wave 3 is unfolding.
Wave Cancel Invalid Level: 11756.730.
The TASI Index is currently in a bullish trend, as indicated by the Elliott Wave analysis on the daily chart. The market is exhibiting an impulsive mode, which suggests strong upward momentum. The ongoing wave structure is identified as Gray Wave 3, positioned within the broader Orange Wave 3, indicating that the market is moving in line with a larger degree upward trend.
The previous Gray Wave 2 has been confirmed as complete, signifying the end of a corrective phase. Now, the market is advancing through Gray Wave 3, which is typically associated with increased momentum and price appreciation, continuing the bullish direction.
Additionally, the analysis highlights a wave cancel invalidation level set at 11756.730. This level acts as a critical threshold for validating the current Elliott Wave pattern. A price drop below this point would invalidate the current wave count, potentially signaling a reversal or a significant market correction.
Summary:
The TASI Index is in a strong upward trend driven by the unfolding of Gray Wave 3 within Orange Wave 3. The completion of Gray Wave 2 suggests the market has transitioned from a corrective phase to an impulsive, upward movement. Traders should closely watch the invalidation level at 11756.730. If breached, it could indicate a disruption in the current bullish structure and suggest a potential shift in market dynamics.
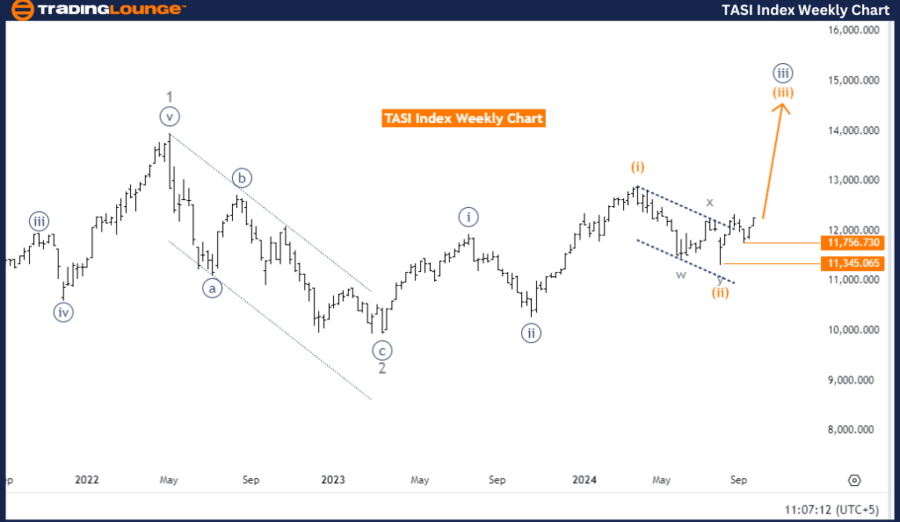
TASI Index Elliott Wave Analysis: Weekly Chart.
TASI Elliott Wave technical analysis
Function: Bullish Trend.
Mode: Impulsive.
Structure: Orange Wave 3.
Position: Navy Blue Wave 3.
Next lower degrees direction: Orange Wave 4.
Details: Orange Wave 2 completed, now Orange Wave 3 is unfolding.
Wave cancel invalid level: 11756.730.
The TASI Index is currently exhibiting a bullish trend on the weekly chart, based on the Elliott Wave analysis. The trend is classified as impulsive, indicating a strong and sustained upward movement. The current wave structure is defined as Orange Wave 3, positioned within the larger Navy Blue Wave 3, suggesting the index is advancing through a higher degree bullish phase.
The completion of Orange Wave 2 signals the end of a corrective phase and the beginning of a new impulsive phase, with Orange Wave 3 now in progress. This wave is typically associated with robust upward movement, driven by increased buying pressure and market momentum. As Orange Wave 3 unfolds, the bullish trend is expected to continue, with potential new highs before any significant correction occurs.
The analysis emphasizes an important invalidation level at 11756.730. A price drop below this threshold would invalidate the current wave count and could indicate a possible shift in the market trend. This level is crucial for traders and analysts to monitor, as it serves as a key reference point for the integrity of the current Elliott Wave structure.
Summary:
The TASI Index is in a strong bullish phase, driven by the progression of Orange Wave 3 within Navy Blue Wave 3. The completion of Orange Wave 2 indicates the index has resumed its upward trajectory after a corrective phase. Traders should closely watch the invalidation level at 11756.730. A drop below this point could signal a potential change in the bullish outlook, but as long as the price remains above this critical level, the upward movement is expected to continue.

Technical analyst: Malik Awais.
TASI Elliott Wave technical analysis [Video]

Read the full article here

 found support at the blue box area")


