SP 500 & NAS100 PRICE FORECAST:
Most Read: Gold (XAU/USD), Silver (XAG/USD) Hold the High Ground as Oil Prices Eye a Recovery
Trade Smarter – Sign up for the DailyFX Newsletter
Receive timely and compelling market commentary from the DailyFX team
Subscribe to Newsletter
US Indices have started the week on a tepid and slightly cautious note. Cyber Monday would appear to be a big hit if early estimates are to be believed and this has kept the retail sector in the spotlight this morning with Amazon (AMZN) and Walmart (WMT) leading the way, up 1.0% and 0.4% respectively.
Source: LSEG
The Retail sector has enjoyed an excellent 2023 thus far, evidenced by the chart above. The retail sector with gains of around 34% while the entire S&P Index up around 19%. Market expectations for Black Friday and Cyber Monday sales are around the $12-$12.4 billion dollar mark. There is a risk that should these numbers miss estimates a selloff (most probably short-term in nature could materialize and maybe something worth monitoring in the days ahead.
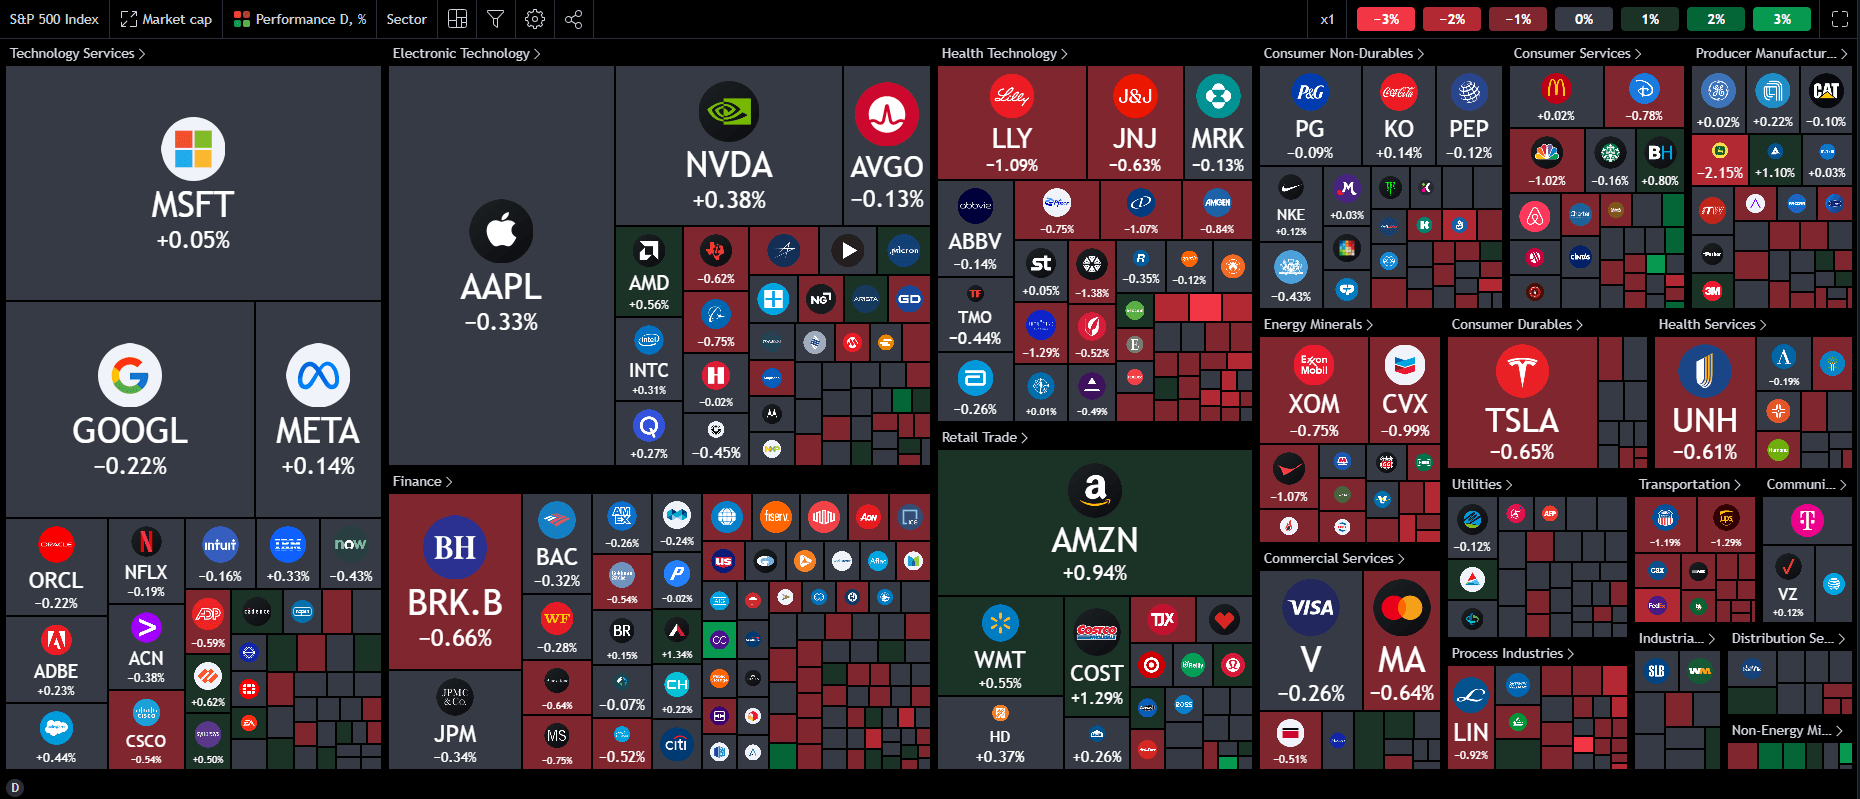
Looking at the heatmap for the SPX today and you can see it hasn’t been the best one so far. Quite a bit of red and grey tiles as opposed to green with the Tech sector also relatively calm today fluctuating between small losses and gains for the most part.

Source: TradingView
US DATA, EARNINGS AND FED SPEAKERS TO DRIVE MARKET SENTIMENT
Markets have been on a tear since optimism around the Federal Reserve being done with its hiking cycle grew. Markets will continue to wait on further cues regarding Fed policy with a key Fed inflation gauge and a host of policymaker scheduled to speak this week.
All of which may have an effect on sentiment and result in changes in the probability of rate cuts in 2024. This would have a knock-on effect on US Indices as the SPX eyes a fresh YTD high above the 4600 mark.
There is also quite abit on the earnings calendar this week with ZScaler reporting today followed by Crowdstrike, Synopses and Salesforce which could also have varying levels of impact on US indices.
For all market-moving economic releases and events, see theDailyFX Calendar
TECHNICAL OUTLOOK AND FINAL THOUGHTS
NASDAQ 100
As mentioned earlier the Nasdaq has enjoyed 4 successive weeks of gains and has already printed a new YTD high, crossing above the 16000 mark. The RIS is hovering around overbought territory and given the recent choppy price action since crossing the 16000 threshold, could a retracement be on its way? I will be keeping my eyes on a potential pullback as market participants might look to do some profit taking during the course of the week.
For now, though immediate support rests at the previous YTD high at 15950 before the 15800 area comes into focus. A break lower than that will bring the 20-day MA and key support area into play around the 15500 and 15300 levels respectively.
An upside continuation does not provide enough historical price action but there is some resistance around the 16150, 16320 and 16700 areas respectively. If price is to reach those highs the reaction should be intriguing.
NAS100 November 27, 2023
Source: TradingView, Chart Prepared by Zain Vawda
S&P 500
The SPX has had a similar run as the NAS100, however it has fallen short of printing a fresh YTD high. The 4600 mark remains a strong hurdle that needs to be crossed and would also signal a fresh YTD high should the SPX push beyond. There have been renewed updates over the past two weeks with many asset managers seeing the SPX ending they year around the 5000 mark.
For this to materialize I believe we may need to see a slightly more dovish rhetoric from the Federal Reserve at the upcoming December meeting. This could materialize following the recent US inflation data and the PCE print this week may provide a further nod in that direction. We also heard positive comments earlier today from White House Spokeswoman Jean-Pierre who stated that the US is seeing lower prices on items from fuel to food which should delight both the Fed and US consumers.
The technical picture looks promising for bullish continuation based on price action and technical signals such as the recent golden cross pattern. However, we may see a pullback ahead of PCE data later this week as market participants may eye taking profit ahead of the release.
Key Levels to Keep an Eye On:
Support levels:
Resistance levels:
S&P 500 November 27, 2023
Source: TradingView, Chart Prepared by Zain Vawda
For tips and tricks regarding the use of client sentiment data, download the free guide below.
| Change in | Longs | Shorts | OI |
| Daily | 7% | 5% | 6% |
| Weekly | -9% | 8% | 1% |
Written by: Zain Vawda, Markets Writer for DailyFX.com
Contact and follow Zain on Twitter: @zvawda
Read the full article here

