NextEra Energy, Inc., (NEE) through its subsidiaries generates, transmits, distributes & sells electric power to retail & wholesale customers in North America. The company generates electricity, through wind, solar, nuclear, natural gas & other clean energy. It comes under Utility sector & trades as “NEE” ticker at NYSE.
As shown in the last article, NEE shown impulse sequence of I ended at $86.10 high. Below there, it favors pullback in II in double three correction against October-2023 low before rally continue. It favors pullback towards $65.86 – $57.50 area before turning higher either in ((X)) or may be new rally.
NEE – Elliott Wave latest weekly view
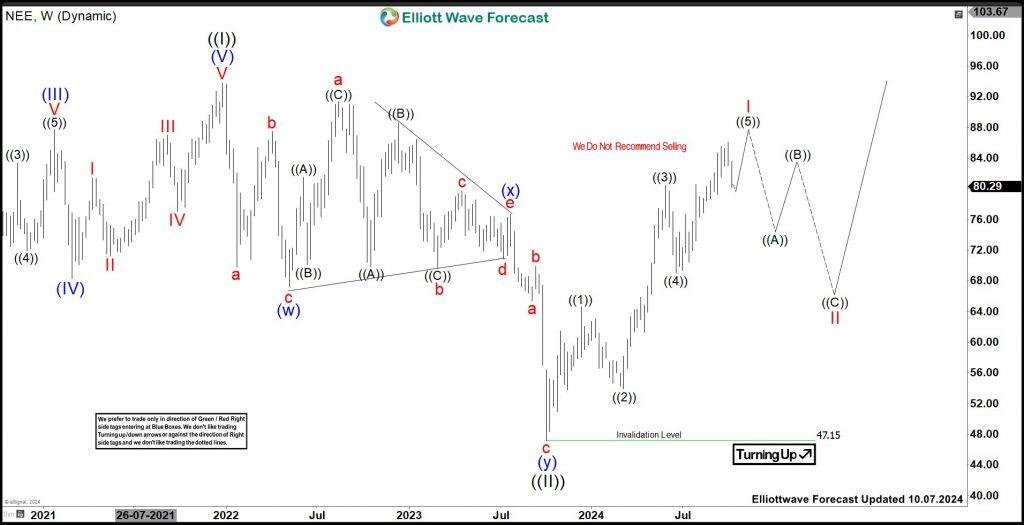
In Weekly, it ended ((I)) sequence at $93.73 high in December-2021. Below, it ended ((II)) at $47.15 low in October-2023 as double three correction. Within ((II)), it placed (w) at $67.22 low as 3 swing pullback, (x) as triangle connector ended at $76.67 high & (y) at $47.15 low in extreme areas. Above there, it favors upside in ((III)) sequence, which confirms when break above $93.73 high.
NEE – Elliott Wave weekly view from 10.07.2024

Since October-2023 low, it ended I impulse at $86.10 high in September-2024. Within I, it placed ((1)) at $64.59 high, ((2)) at $53.95 low, ((3)) at $80.47 high, ((4)) at $68.97 low & finally ((5)) at $86.10 high. Currently, it favors double three correction lower in II. It placed (W) at $72.69 low, (X) at $79.38 high & favors lower in (Y) towards $65.86 – $57.50 area to finish ((W)) of II. Buyers should take control from the extreme areas to bounce either in ((X)) or upside in III, which confirms above I high. In any situation, it should see at least 3 swing bounce soon towards $70 or higher levels.
Read the full article here

