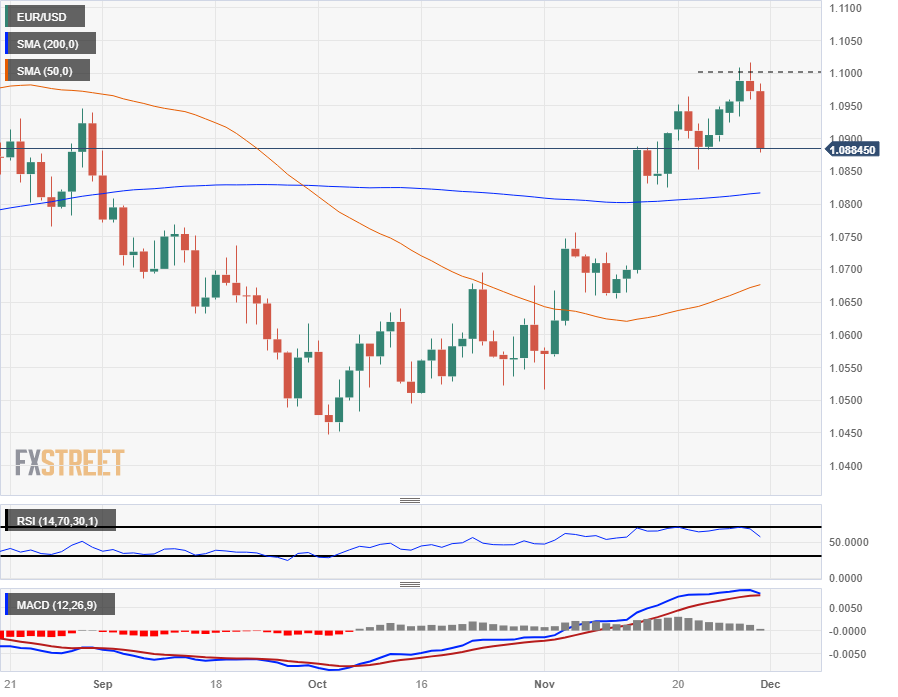
- The EUR/USD comes under pressure as markets turn back towards the US Dollar.
- Inflation readings are beginning to flub market expectations.
- The Euro is set for a return to the 1.0800 handle, US Manufacturing PMI data to close out the week.
The EUR/USD is continuing to decline into the Thursday market close, testing 1.0880 with the Euro (USD) down over eight-tenths of a percent against the US Dollar (USD) for the day.
European markets and the EUR tumbled after Eurozone inflation came in broadly below expectations, with the annualized Eurozone Core Harmonized Index of Consumer Prices (HICP) inflation for November printing at 3.6%, below the forecast 3.9% and slipping further back from the previous period’s 4.2%.
With inflation receding faster than markets were expecting across the Eurozone, the Euro slipped against the Greenback, and losses continued in Thursday’s US session after US inflation also missed the mark, with US Personal Consumption Expenditure (PCE) Price Index inflation missing the market’s meagre forecast of just 0.1%, printing a flat 0.0% after prices failed to inflate in October.
Annualized PCE for the year into October printed as-expected at 3% compared to September’s annualized reading of 3.4%, and the deceleration of inflation at the close end of the curve is making market participants nervous, sending a risk-off shudder through the markets and picking the US Dollar back up against nearly all major currencies.
US ISM Manufacturing PMI to close out the economic calendar on Friday
US manufacturing expectations are the last significant data on the economic calendar for the trading week, slated for Friday. The Institute for Supply Management’s (ISM) Manufacturing-focused Purchasing Managers’ Index (PMI) is expected to show a uptick in purchasing managers’ industry-level activity outlook, with the November MoM figure forecast to print at 47.6 compared to October’s reading of 46.7.
US Dollar price today
The table below shows the percentage change of US Dollar (USD) against listed major currencies today. US Dollar was the strongest against the Japanese Yen.
| USD | EUR | GBP | CAD | AUD | JPY | NZD | CHF | |
| USD | 0.79% | 0.58% | -0.17% | 0.14% | 0.82% | -0.04% | 0.27% | |
| EUR | -0.80% | -0.23% | -0.98% | -0.67% | 0.03% | -0.85% | -0.55% | |
| GBP | -0.58% | 0.24% | -0.75% | -0.42% | 0.28% | -0.61% | -0.30% | |
| CAD | 0.18% | 0.96% | 0.75% | 0.32% | 1.01% | 0.14% | 0.45% | |
| AUD | -0.17% | 0.67% | 0.43% | -0.30% | 0.70% | -0.19% | 0.12% | |
| JPY | -0.84% | -0.02% | -0.26% | -0.99% | -0.73% | -0.86% | -0.55% | |
| NZD | 0.01% | 0.83% | 0.62% | -0.13% | 0.18% | 0.86% | 0.31% | |
| CHF | -0.26% | 0.55% | 0.31% | -0.44% | -0.13% | 0.57% | -0.30% |
The heat map shows percentage changes of major currencies against each other. The base currency is picked from the left column, while the quote currency is picked from the top row. For example, if you pick the Euro from the left column and move along the horizontal line to the Japanese Yen, the percentage change displayed in the box will represent EUR (base)/JPY (quote).
EUR/USD Technical Levels
The EUR/USD is in play at its lowest bids in a week near 1.0880, with intraday action making a clean break of a rising trendline from last week’s swing low into 1.0860.
The pair has slid past the 200-hour Simple Moving Average (SMA), as the 50-hour SMA rolls over into a bearish tilt as near-term momentum flips into the low side.
The Euro is down eight-tenths of a percent against the US Dollar, and daily candlesticks have the EUR/USD heading back towards the 200-day SMA just north of the 1.0800 handle after seeing a clean technical rejection of the 1.1000 major handle in the mid-week.
EUR/USD Hourly Chart
EUR/USD Daily Chart

EUR/USD Technical Levels
Read the full article here

