EUR/USD & GOLD PRICE FORECAST
- Gold prices and EUR/USD could gain ground in the near term, but the broader trend may hinge on incoming U.S. economic data
- Attention will be on the ISM services PMI and the U.S. labor market report later this week
- This article looks at XAU/USD and EUR/USD’s key levels to watch in the coming days
Trade Smarter – Sign up for the DailyFX Newsletter
Receive timely and compelling market commentary from the DailyFX team
Subscribe to Newsletter
Most Read: Fed Stays Put, Keeps Hiking Bias; Gold & US Dollar Display Limited Volatility
The Federal Reserve today concluded its penultimate meeting of 2023. As expected, the institution led by Jerome Powell decided to maintain its benchmark interest rate unchanged at its current range of 5.25% to 5.50%. In terms of forward guidance, the central bank stuck to the script and kept the door open to further policy firming in case a more restrictive stance is needed later on to curb inflation.
Despite the FOMC’s tightening bias, Powell failed to steer market pricing toward another hike, as he has done in the past when economic conditions warranted a more aggressive stance. Although his press conference contained some hawkish elements, a strong conviction in the need to continue raising borrowing costs was absent, a sign that the normalization cycle may have already ended.
With policymakers seemingly more cautious, perhaps aware that the full effects of past actions have yet to be felt, the U.S. dollar could soon be topping out. However, to have confidence in this assessment, incoming data will have to confirm that the outlook is beginning to deteriorate rapidly in response to increasingly restrictive financial conditions.
Traders will have a chance to gauge the health of the overall economy later this week when the ISM services PMI survey and October U.S. employment figures are released. If both reports surprise to the downside by a wide margin, as the ISM manufacturing indicator did, there could be scope for a large pullback in the broader U.S. dollar. This scenario would boost EUR/USD and gold prices (XAU/USD).
UPCOMING US ECONOMIC REPORTS
Source: DailyFX Economic Calendar
EUR/USD TECHNICAL ANALYSIS
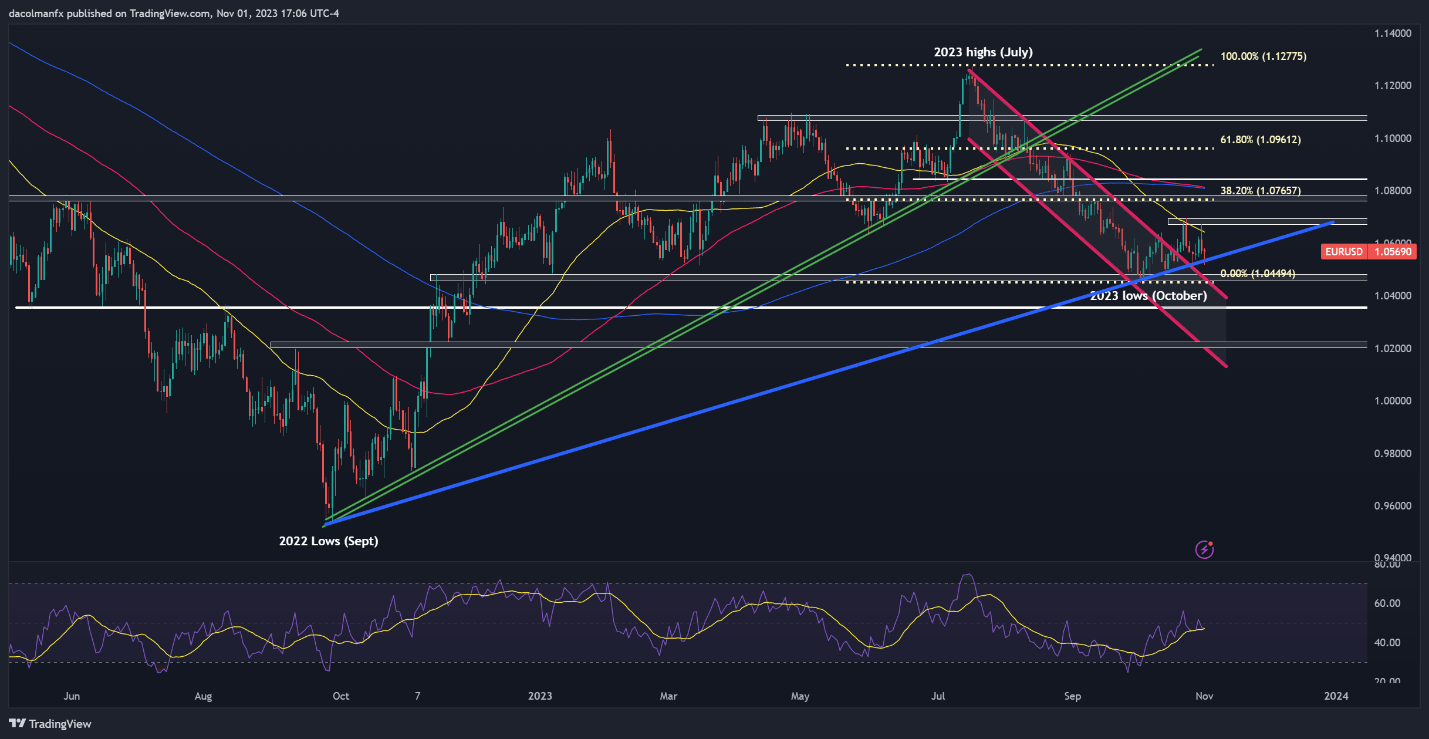
EUR/USD was on course for a moderate drop on Wednesday, but then reversed course after bouncing off medium-term trendline support. Despite recent price action, the underlying bias remains bearish, but to be confident that the losses will accelerate, the bears need to push prices below 1.0535. Should this scenario unfold, we could see a move towards the 1.0500 handle. On further weakness, the focus shifts to 1.0355.
Conversely, if the bulls return in force and manage to drive the exchange rate decisively higher, initial resistance lies between 1.0670 and 1.0695. Upside clearance of this technical ceiling could reignite upward impetus, paving the way for a rally towards 1.0765, the 38.2% Fibonacci retracement of the July/October descent.
Curious about the expected path for EUR/USD and the market catalysts that should be on your radar? Explore all the details in our Q4 euro trading forecast. Download it now!
Recommended by Diego Colman
Get Your Free EUR Forecast
EUR/USD TECHNICAL CHART

EUR/USD Chart Created Using TradingView
Wondering how retail positioning can shape gold prices? Our sentiment guide provides the answers you are looking for—don’t miss out, grab a free copy today!
| Change in | Longs | Shorts | OI |
| Daily | -3% | 8% | 1% |
| Weekly | -5% | 6% | -1% |
GOLD PRICE (XAU/USD)TECHNICAL ANALYSIS
Gold (front-month future contracts) has rallied sharply since its October lows, but has struggled to clear resistance in the $2,010/$2,015 range. Attempts to breach this area in recent weeks have been met with downward rejections every single time, a sign that the bulls have not mustered the required strength to spark a breakout.
To gain insight into XAU/USD’s outlook in the short term, it’s essential to monitor how prices progress in the coming trading sessions, taking into account two potential scenarios.
Scenario 1: If the yellow metal manages to take out the $2,010/$2,015 barrier, bullish momentum could gather pace, creating the right conditions for a move towards last year’s high around $2,085.
Scenario 2: If sellers engineer a strong comeback and push gold prices below support at $1,980, losses could accelerate, paving the way for a possible test of the 200-day simple moving average at $1,945. Below this threshold, attention turns to $1,920.
GOLD PRICE CHART (FRONT-MONTH FUTURES)
Gold Futures Chart Created Using TradingView
Read the full article here

