


Ripple’s price has been consolidating in a very tight range in the last few days, and it has yet to give any indication of its future direction.
By Edris Derakhshi (TradingRage)
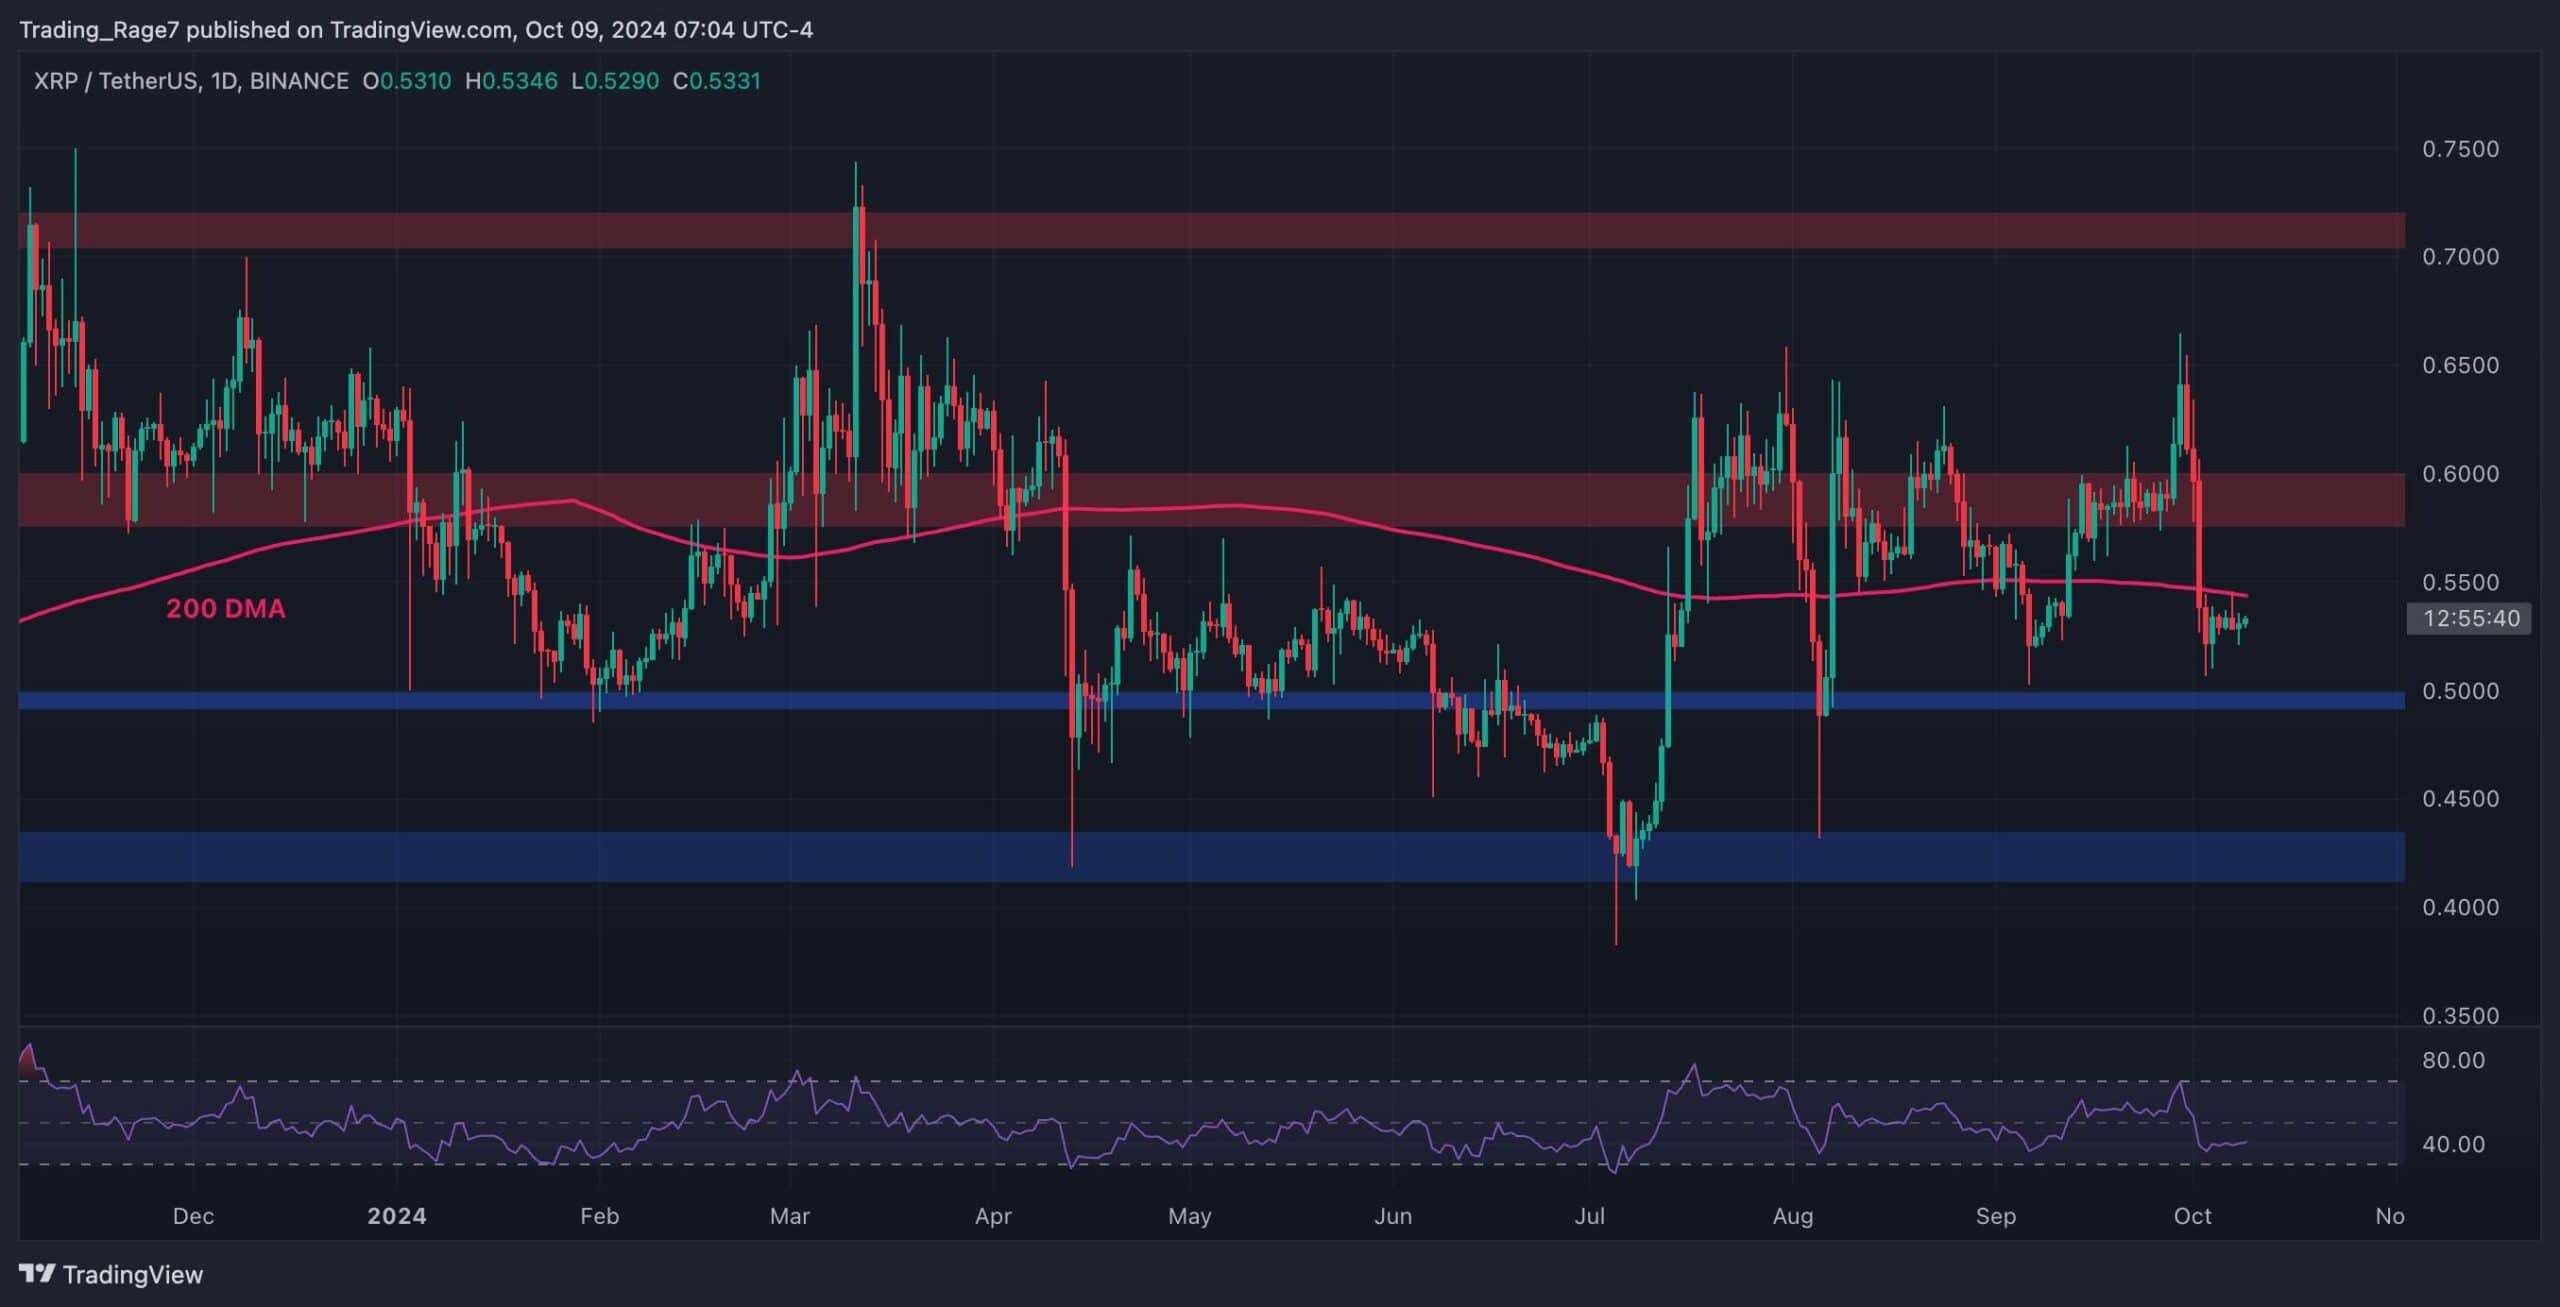
The USDT Paired Chart
On the USDT paired chart, the price has recently experienced a massive drop from the $0.65 level, breaking below the 200-day moving average, which is located near the $0.55 mark.
Over the last week, the market has been moving sideways below the 200-day moving average and has failed to break back above it.
As the structure suggests, a further decline toward the key $0.5 support level is likely in the short term. Yet, a rebound could still be expected from that area.
The BTC Paired Chart
The BTC paired chart is in a similar condition.
The market has failed to rise above the 1000 SAT mark and is currently testing the 800 SAT support level and the 200-day moving average, located around the same price.
If these levels are broken to the downside, a drop toward 650 SAT could be expected in the coming weeks.
On the other hand, a rebound from the 800 SAT area could lead to a rally toward the 1,200 SAT, but this scenario is far less probable than the bearish one.


Read the full article here


