


By Shayan
The recent upward momentum in Bitcoin’s price encountered resistance upon reaching the significant $37K mark.
However, the market has entered into a consolidation phase, with the price oscillating within the range defined by $37 and $35K. A breakout from this critical range will determine the subsequent trajectory for Bitcoin.
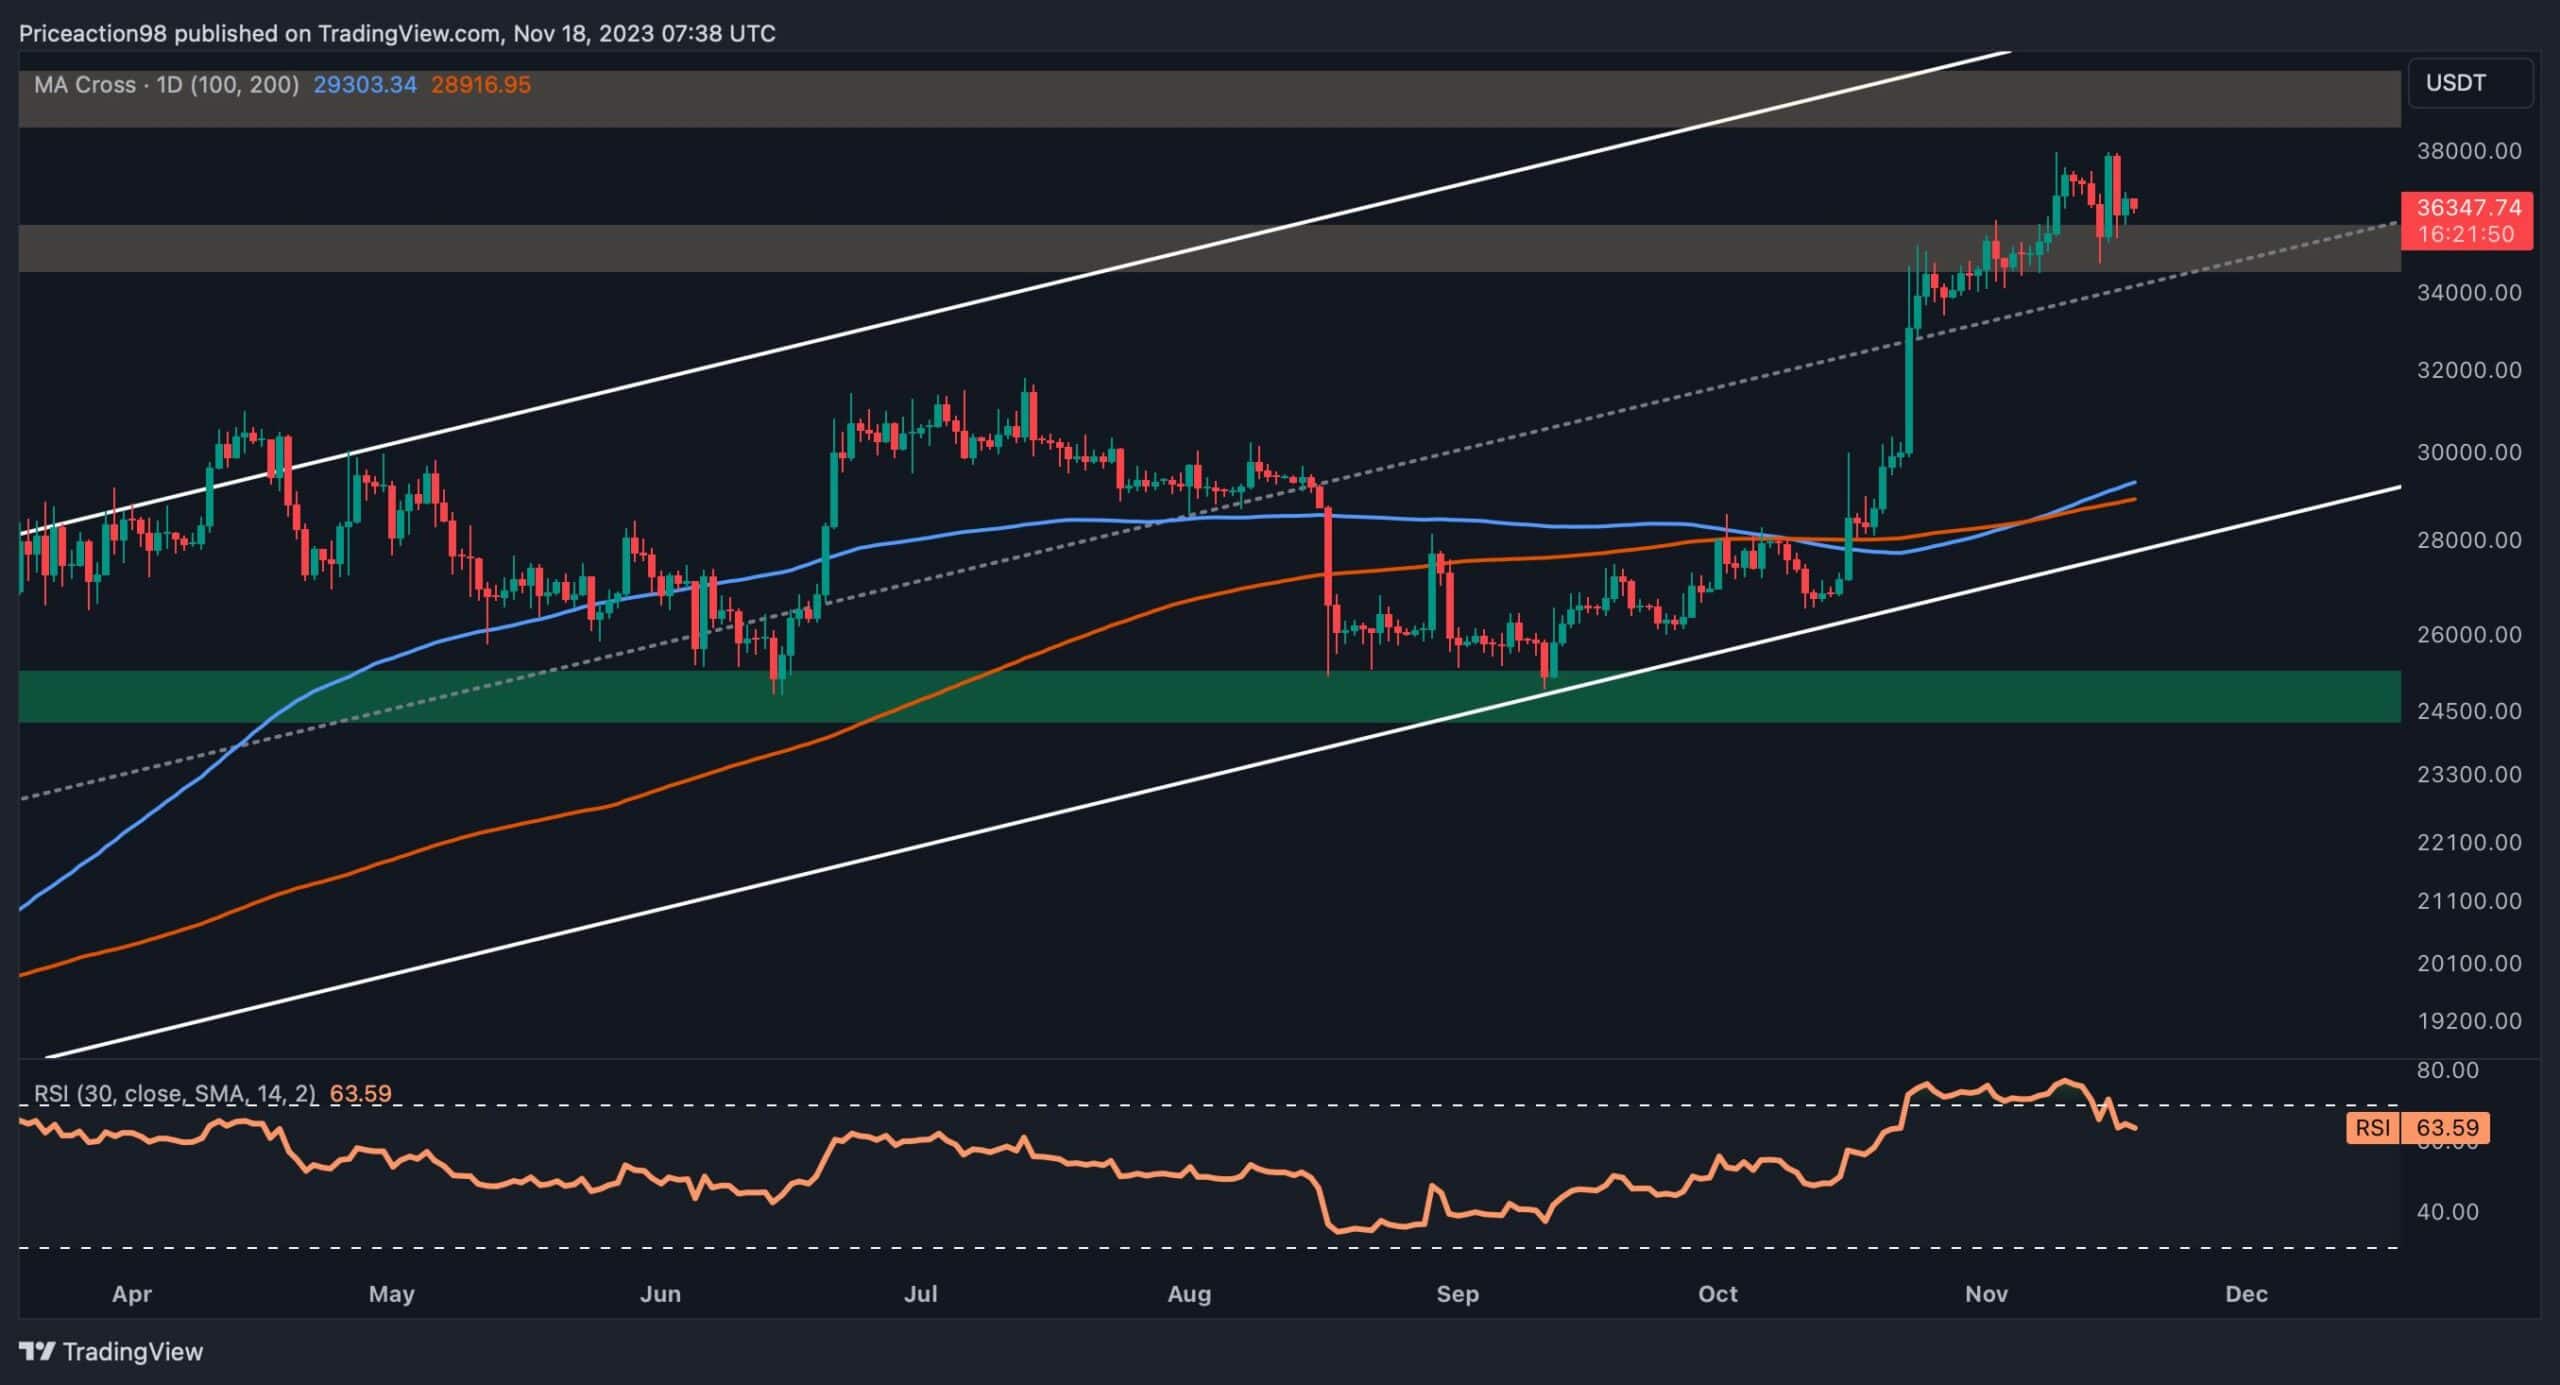
The Daily Chart
On the daily chart, the substantial uptrend in Bitcoin lost steam after breaking out from the $35K resistance zone and the middle trendline of the extended ascending channel. This transition led to a consolidation stage, presenting a crucial range between the resistance of $37K and the critical $35K support. Hence, Bitcoin’s future prospects will be determined by the price breaking out of this decisive range.
Despite several bullish signals indicating increased demand, the scenario of a short-term consolidation correction with minor retracements appears more plausible. Initial support for buyers is anticipated at the middle boundary of the ascending channel and the $35K support zone.
Examining the 4-hour chart, Bitcoin’s price movement decelerated around the crucial $35K resistance and eventually entered a consolidation phase.
Although the price managed to surpass this resistance, reaching $37K, it also formed an ascending wedge pattern. Ultimately, attempts to breach this level faced heightened supply, resulting in a notable rejection.
The presence of an ascending wedge pattern, signaling a potential price reversal, coupled with an expanded bearish divergence between the price and the RSI indicator, suggests a need for a short-term retracement. In the event that sellers take control, a long squeeze event could unfold, pushing the price below the established ascending wedge pattern. Key support levels in such a scenario include the 0.5 Fibonacci retracement level at $32,300.


By Shayan
Bitcoin’s recent notable uptrend has been significantly influenced by the futures market. Hence, to ensure the sustainability of this ongoing uptrend, it is crucial for the futures market to maintain favorable conditions.
The provided chart depicts the 30-day moving average of the Bitcoin funding rate, a vital metric for assessing sentiment in the futures market. Positive funding rates indicate the dominance of long-position traders who are willing to pay funding to short traders.
During the period of a substantial surge in Bitcoin’s price, the funding rate metric exhibited a robust uptrend, signaling strong buying interest in the futures market. This positive trend aligns with the recent uptrend in the market, indicating that a majority of participants are inclined toward taking long positions. This overall bullish sentiment suggests the potential for further price appreciation.
However, it is crucial to note that an overheated futures market introduces the possibility of a long-squeeze event. A slight price rejection could trigger a short-term cascade, leading to the liquidation of long positions. Consequently, prudent risk management strategies are advisable during such market conditions to navigate potential fluctuations and unexpected events.


Read the full article here


")


