


Technical analysis is a crucial indicator that investors, especially those involved in futures trading, need to constantly follow in the cryptocurrency market. So, what clues does technical analysis provide for Ethereum, which is currently trading at $2061? Let’s examine in detail the charts, important support and resistance levels.
Daily Chart Analysis for Ethereum
The rising channel formation structure on the daily chart of Ethereum continues to work. This formation, which provides important clues to investors with the bar formations that occurred after the FTX bankruptcy in July 2022, continues to provide important details for investors involved in futures trading. Recently, after the developments in Binance, Ethereum also gained significant momentum.
The most important support levels to be monitored for Ethereum on the daily chart are respectively $2031, $1928, and $1875. Especially, if the daily bar closes below the critical level of $1928, it may cause a significant loss of momentum for Ethereum.
The most important resistance levels to be noted on the daily chart for Ethereum are respectively $2139, $2246, and $2336. Especially, if the daily bar closes above the significant barrier of $2139, it will lead to a significant gain of momentum for Ethereum.
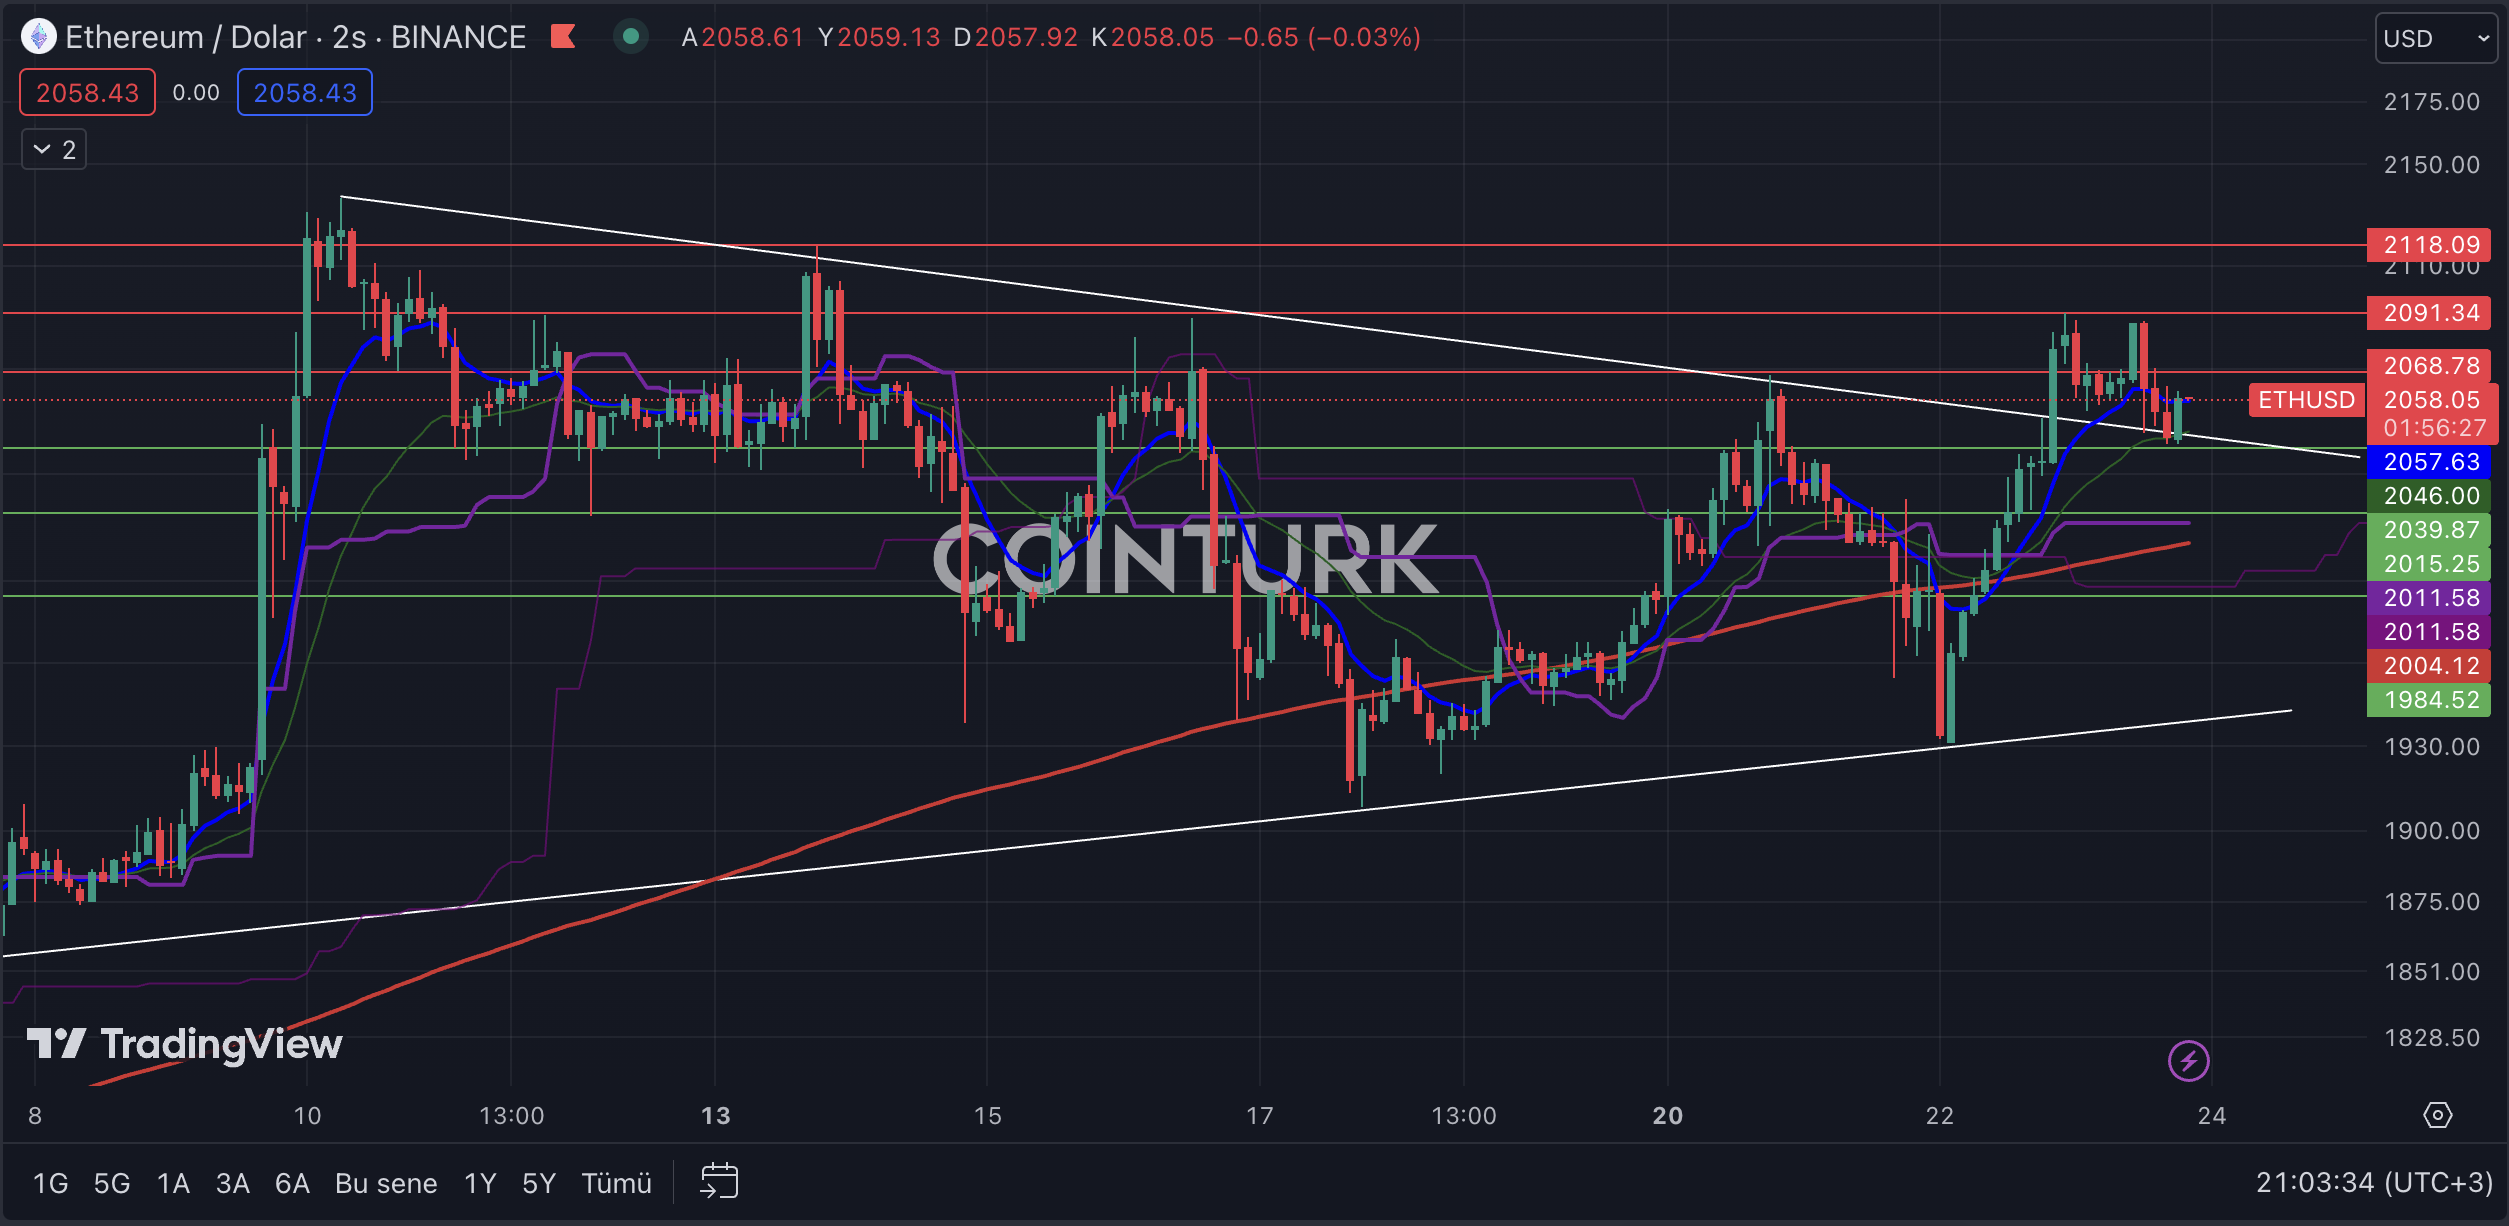
Two-Hour Chart Analysis for Ethereum
After the support touch on November 22nd in the narrowing channel formation on the two-hour Ethereum chart, a resistance breakout occurred, and the Ethereum price encountered a significant resistance level. The support role of the resistance line in the last bar formations may result in a positive scenario for the price.
The most important support levels to be monitored on the two-hour chart for Ethereum are respectively $2039, $2015, and $1984. Especially, if the two-hour bar closes below the critical level of $2039, the gained momentum in Ethereum price will weaken.
The most important resistance levels to be noted on the two-hour chart for Ethereum are respectively $2068, $2091, and $2118. Especially, if the bar closes above the significant barrier of $2091, it will help Ethereum price gain momentum.

Read the full article here


 to Tornado Cash Developer Roman Storm’s Legal Defense Fund")


