


By Shayan
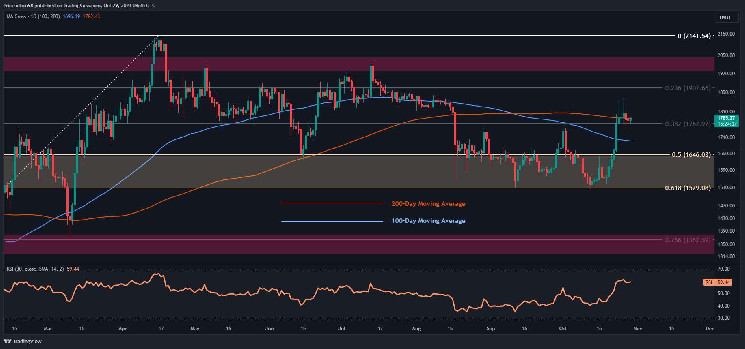
Last week, Ethereum displayed an interesting sign by surpassing the 100-day moving average, indicating the growing interest.
However, a significant hurdle lies ahead, represented by the 200-day moving average. A breakthrough at this level could reignite substantial demand in the market.
Upon inspecting the daily chart, a robust uptrend emerged from the crucial $1.5K support region, with buyers impulsively driving the price above the 100-day moving average at $1,7K. This surge revived hope and demand, evident in Ethereum’s price action over the past weeks, as it convincingly breached the 100-day MA with a notably large bullish candlestick.
Presently, ETH faces a pivotal obstacle at $1.8K, restricted by the 200-day moving average. A successful breakout above this level could result in a strong uptrend, targeting the solid resistance at $2K. However, given the substantial recent surge, the market might undergo a temporary correction before initiating another significant move.
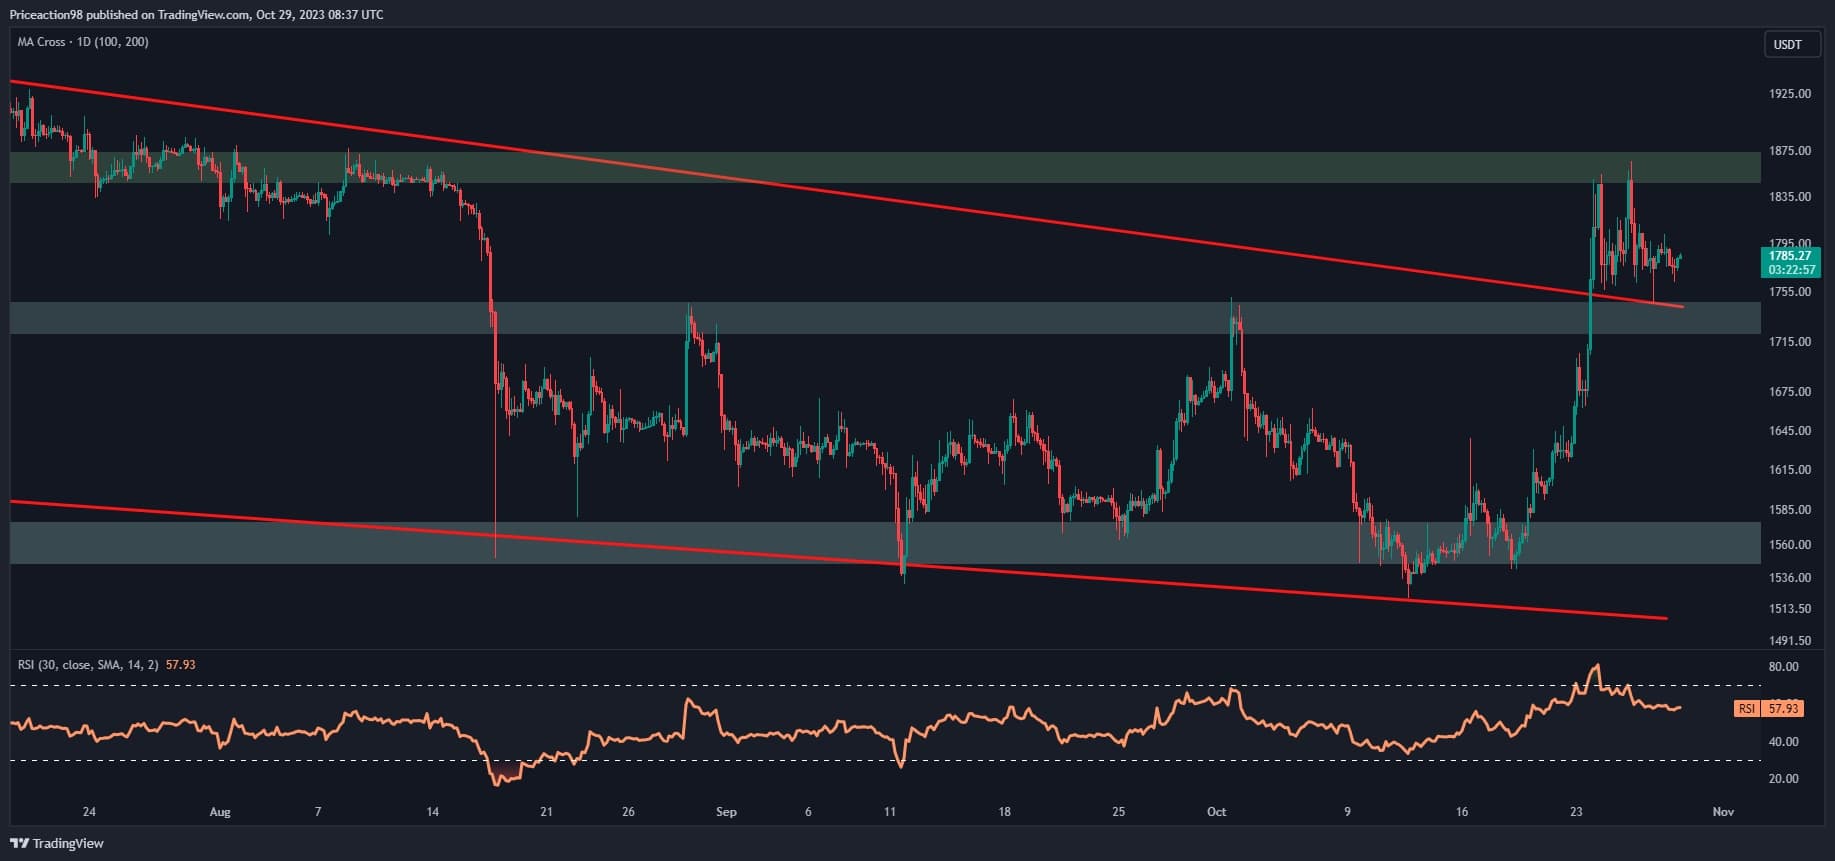
The 4-hour chart highlights intensified bullish momentum and a steadily rising demand, clearly visible in Ethereum’s recent price action. The past weeks have witnessed a compelling uptrend for Ethereum, characterized by significant bullish candles that surpassed key resistance levels.
Additionally, Ethereum exhibited a promising sign by breaching a significant resistance zone, encapsulated by the upper boundary of the descending wedge and the static resistance level of $ 1.7K, confirming the wedge’s reversal signal.
However, the price currently contends with a crucial resistance zone around $1,850, leading to a sideways consolidation phase. This period allows the market to regain demand and attempt to breach the resistance region.
Consequently, there is a high probability of a continued consolidation correction stage before the market definitively determines its next direction.

By Shayan
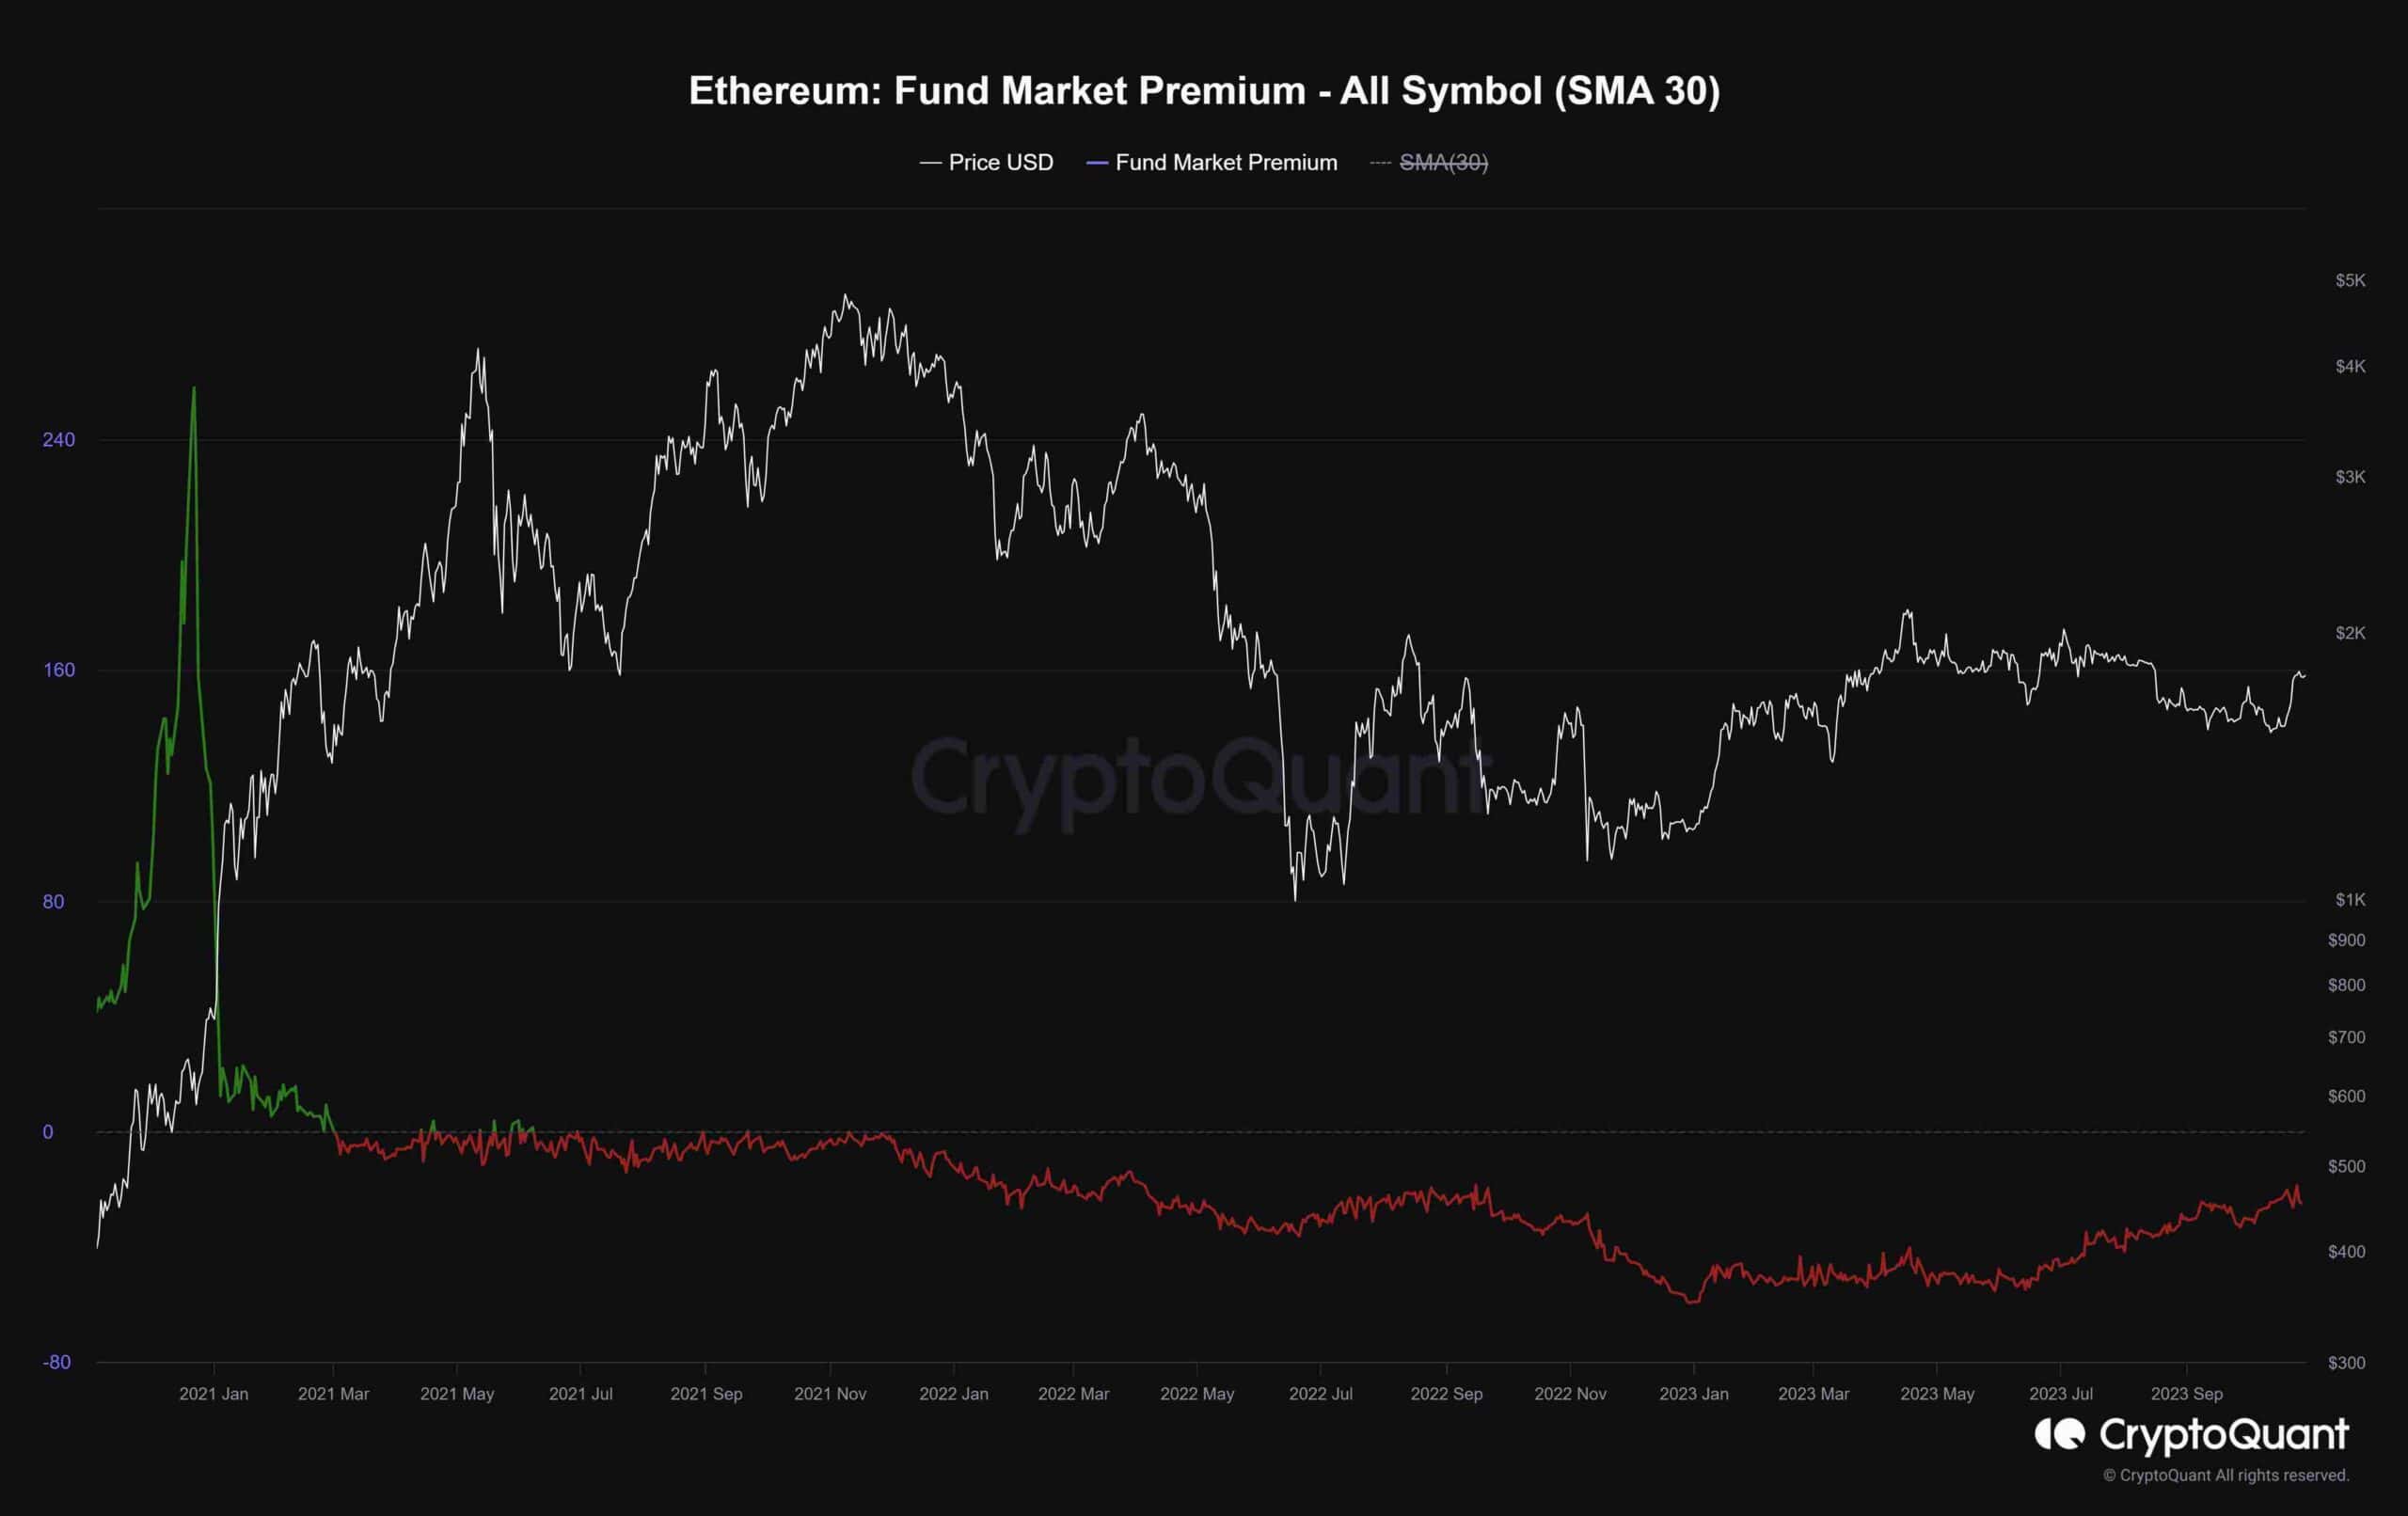
The fund market premium metric plays a crucial role as it signifies the excess of the market price over the Net Asset Value (NAV) of the funds, reflecting the underlying assets they hold. Elevated readings indicate robust buying pressure within a specific country.
Upon analyzing the chart, it becomes evident that this metric had declined since Ethereum achieved its all-time high in mid-November 2021, indicating waning interest in Ethereum funds. However, a noteworthy shift occurred following Ethereum’s lowest point during the bear market. At that juncture, the metric began a modest uptick.
Between January 2023 and the present date, there has been consistent growth in the premium for Ethereum funds, indicating a surge in investor enthusiasm for these assets. This trend points toward a growing demand for Ethereum within the market.
Should the premium for Ethereum funds persist in its upward trajectory, it signifies a reduction in the gap between the market price and the actual market value of Ethereum contracts. This convergence strongly suggests that investors are increasingly optimistic about ETH’s potential.

Read the full article here


")
