


Ethereum has been rejected from the crucial 100-day MA of $2.7K, indicating a bull trap. This price action hints at sellers’ dominance, with the asset expecting to continue its descending consolidation stage toward the $2.1K threshold.
Technical Analysis
By Shayan
The Daily Chart
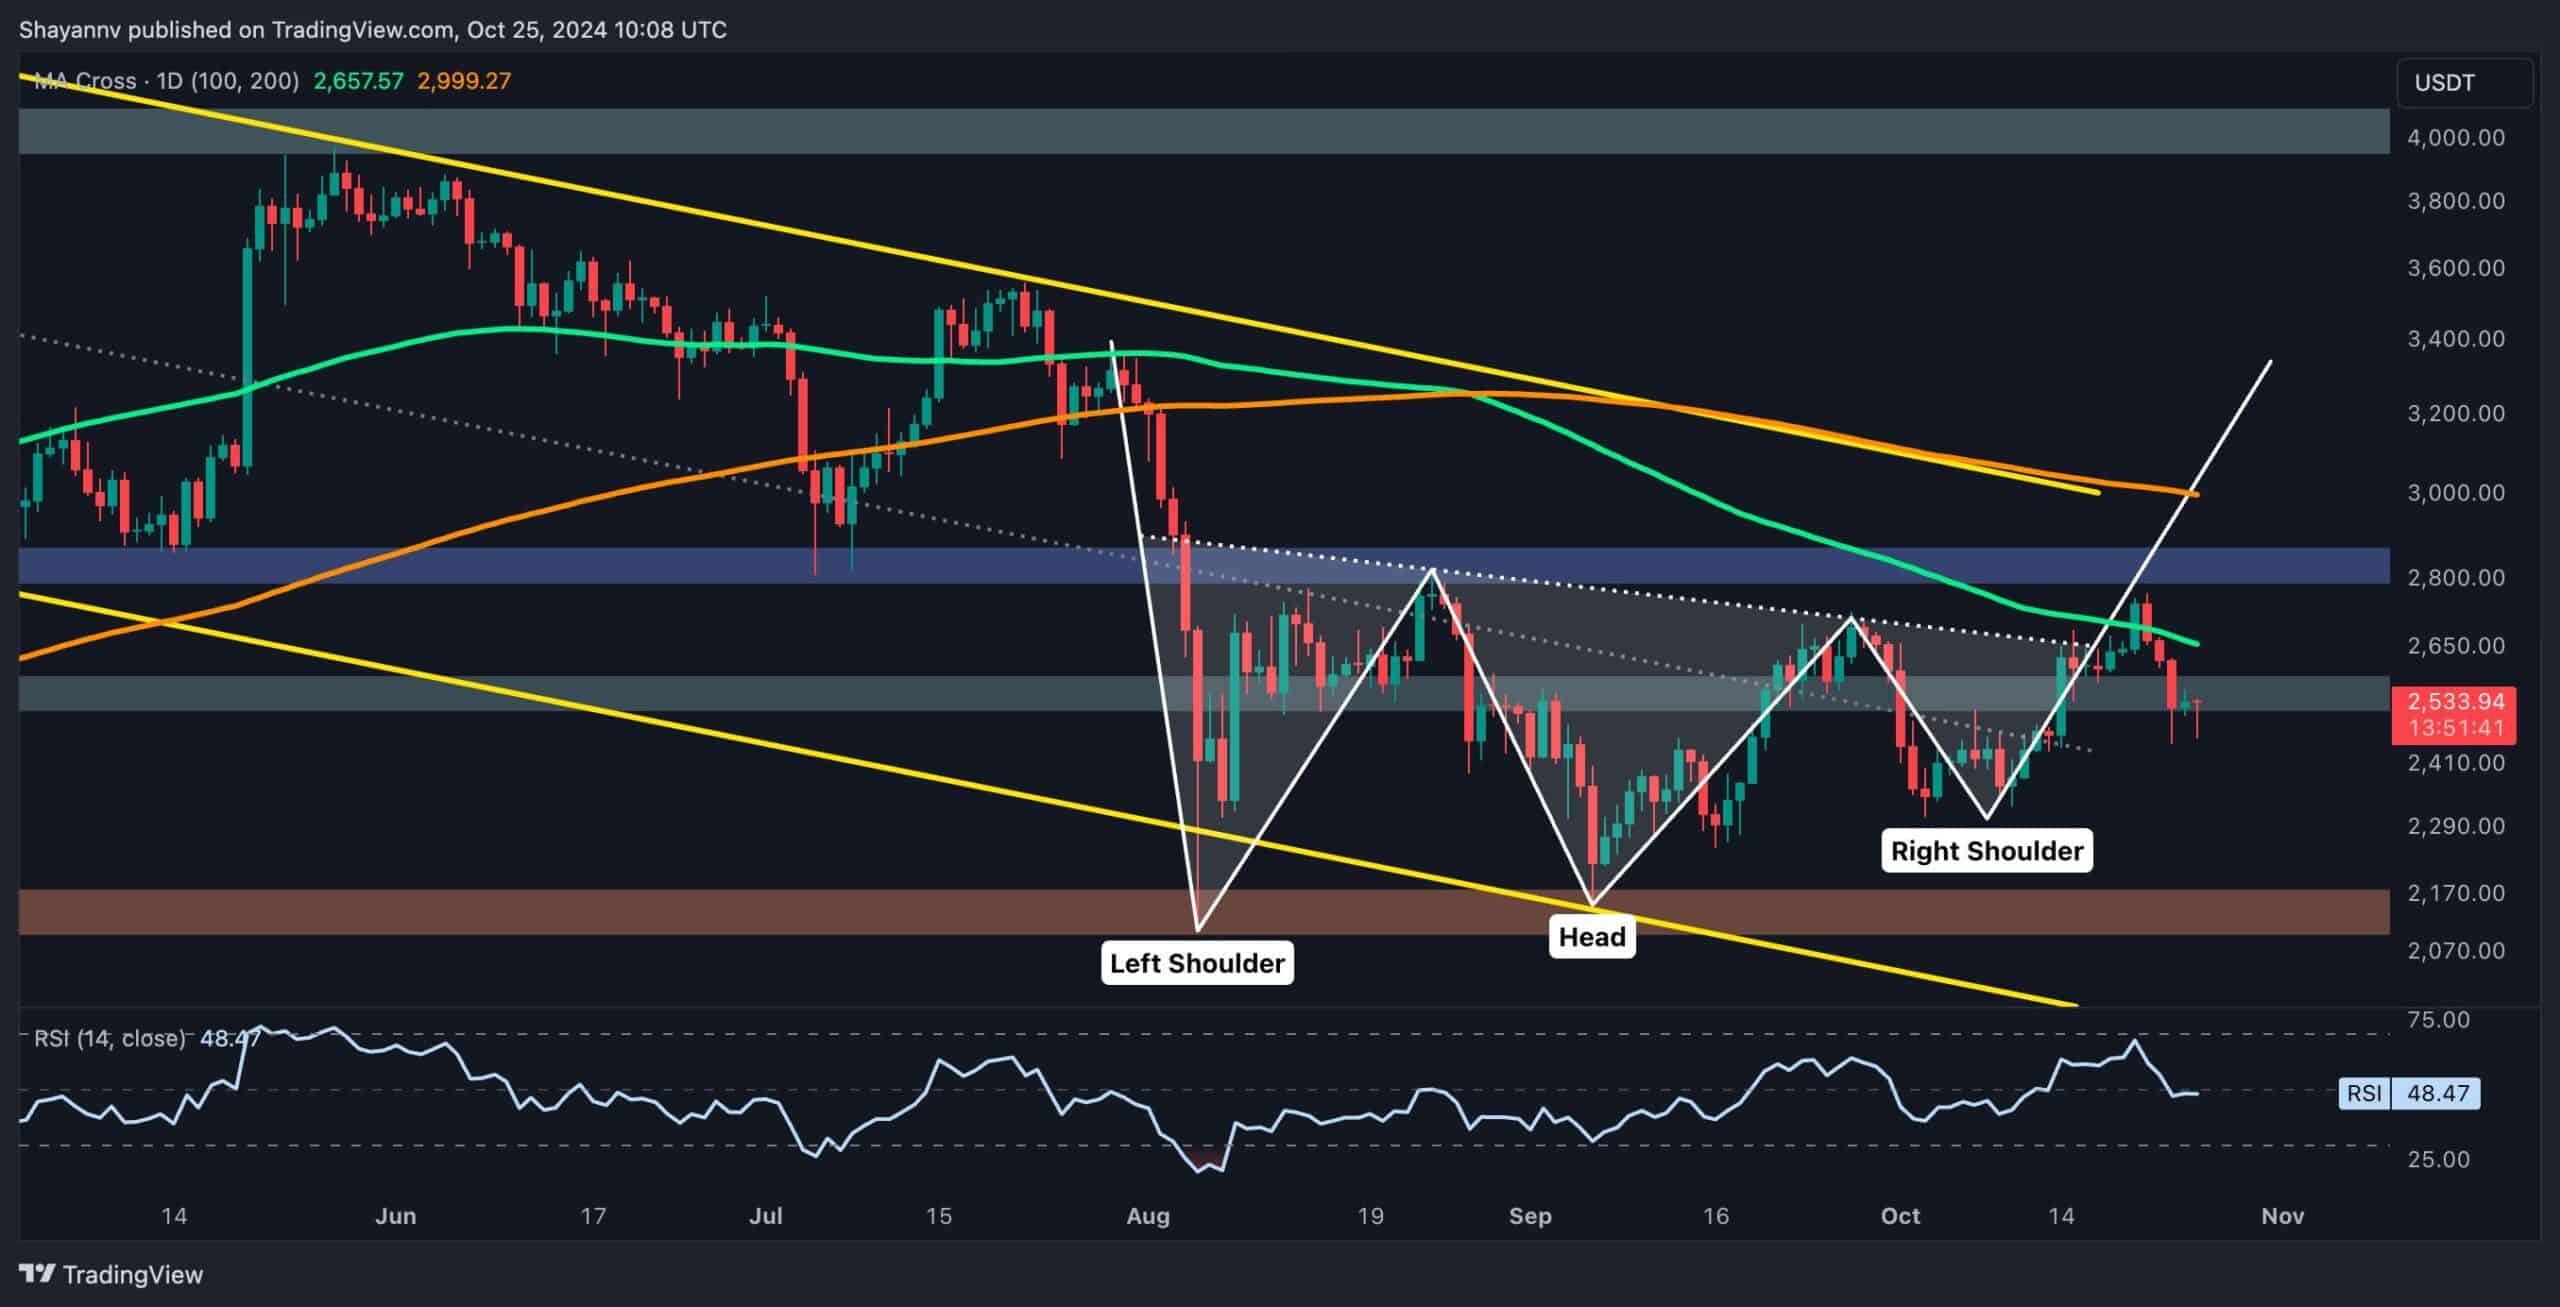
Ethereum recently experienced a surge that breached the 100-day moving average at $2.7K and the neckline of an inverted head and shoulders pattern, triggering a short liquidation event. This initial move was a bullish signal, briefly sending the price higher. However, a rejection at the $2.7K level has led to a 12% decline, pushing the price back below the 100-day MA and the neckline.
This suggests the breakout was false, forming a classic bull trap and highlighting the sellers’ growing dominance. Ethereum is now consolidating near the $2.5K support zone, but the price is expected to continue its descent, with the next major target being the $2.1K support level.
The 4-Hour Chart
In the 4-hour timeframe, ETH’s brief push above the 0.618 Fibonacci level ($2.7K) was met with substantial selling pressure, most likely from smart money or institutional traders. These market participants exploited the liquidity above $2.7K, executing sell orders in a manipulative move that led to a sudden price drop.
Ethereum has since fallen to the lower boundary of its ascending flag pattern, currently sitting around the $2.4K region. This level may provide short-term support and could trigger consolidation within the flag.
ETH could hold at this level for the short term, entering a consolidation phase before determining its next move. If buying pressure increases, a potential retest of the $2.7K resistance might occur. However, a breakdown from the $2.4K support would likely trigger further bearish momentum, with Ethereum heading toward the $2.1K critical support as the next primary target.


Onchain Analysis
By Shayan
The aforementioned significant rejection at the $2.7K resistance zone represents an area characterized by a high concentration of short positions. The futures market analysis sheds light on the underlying dynamics, as smart money likely exploited this liquidity pool to trigger liquidations and execute their sell orders.
This strategic move by institutional traders caused Ethereum’s price to surge temporarily, only to face rejection and begin a downward correction.
The liquidity concentration now shifts below the $2.4K support level, indicating ETH’s next probable target in the mid-term. The presence of considerable liquidity below this zone makes it an attractive area for market participants, suggesting that Ethereum may continue its descent toward the $2.4K region and possibly further, as part of its corrective phase.
Given the technical setup and future market dynamics, Ethereum is expected to maintain downward pressure in the coming days, with a potential target below $2.4K.

Read the full article here


