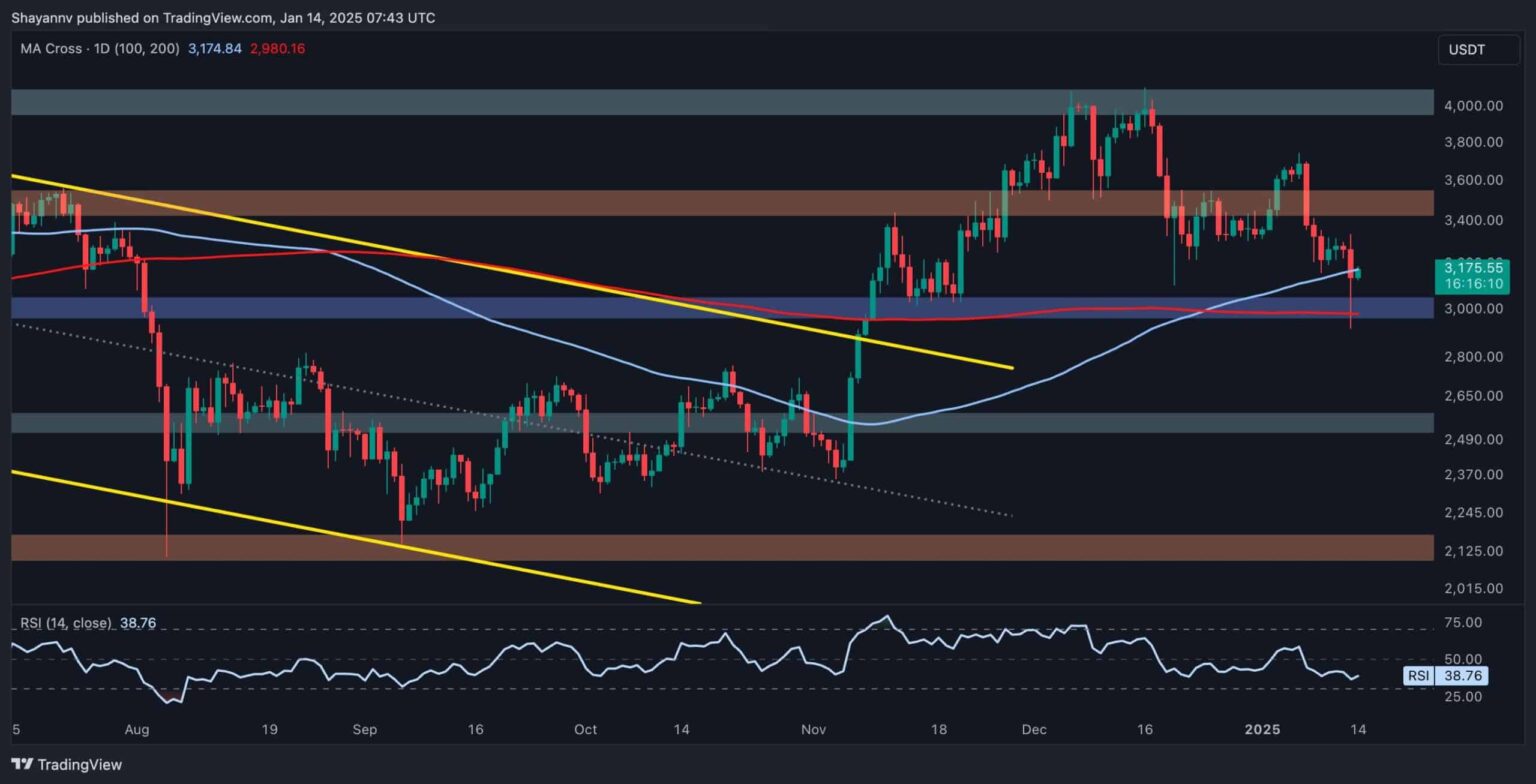
Ethereum has displayed bearish signals after breaking below its 100-day moving average, underscoring increased selling activity.
However, the 200-day MA, acting as the buyers’ last defense, still holds, offering hope for a potential rebound.
Technical Analysis
By Shayan
The Daily Chart
ETH recently broke below the significant 100-day MA at $3.1K, signaling the sellers’ growing dominance. This breakdown points to a potential test of the $3K support region, a critical juncture aligned with the 200-day MA.
Currently, Ethereum is finding temporary support at this level, with a modest bullish reversal hinting at demand from buyers. The 200-day MA serves as the primary defensive line for bulls, and its ability to hold will determine the short-term trajectory. A breakdown below this level could trigger a mid-term bearish trend, targeting the $2.5K support zone.
The 4-Hour Chart
On the 4-hour timeframe, ETH saw consolidation near the 0.5 Fibonacci retracement level ($3.2K) before sellers overwhelmed the market, breaking below this critical support. This triggered a wave of long liquidations, driving the price toward the 0.618 Fibonacci retracement level at $3K.
This region is pivotal, as it represents the last major support zone for buyers. A sustained breach below this level could lead to a cascade of liquidations, driving the price toward the $2.5K target. However, Ethereum appears to be consolidating around this juncture, with a potential battle between buyers and sellers unfolding.
Onchain Analysis
By Shayan
Ethereum is testing the critical $3K support region, with sellers exerting pressure to reclaim control. Insights from the Taker Buy Sell Ratio provide a glimpse into market sentiment and potential direction.
Upon reaching the $3K support region, the Taker Buy Sell Ratio initially surged, reflecting increased buying power and a defensive stance by buyers. However, this trend was short-lived as a subsequent sell-off coincided with a bearish reversal in the metric. Since then, the ratio has steadily declined, signaling a growing dominance of sellers in the market.
If this trend persists, the likelihood of a breakdown below the $3K threshold increases. Such a scenario would likely lead to heightened selling activity, pushing ETH toward the $2.5K support level. Conversely, a reversal in the ratio could indicate renewed buyer interest, stabilizing the price at this critical juncture.
Read the full article here

