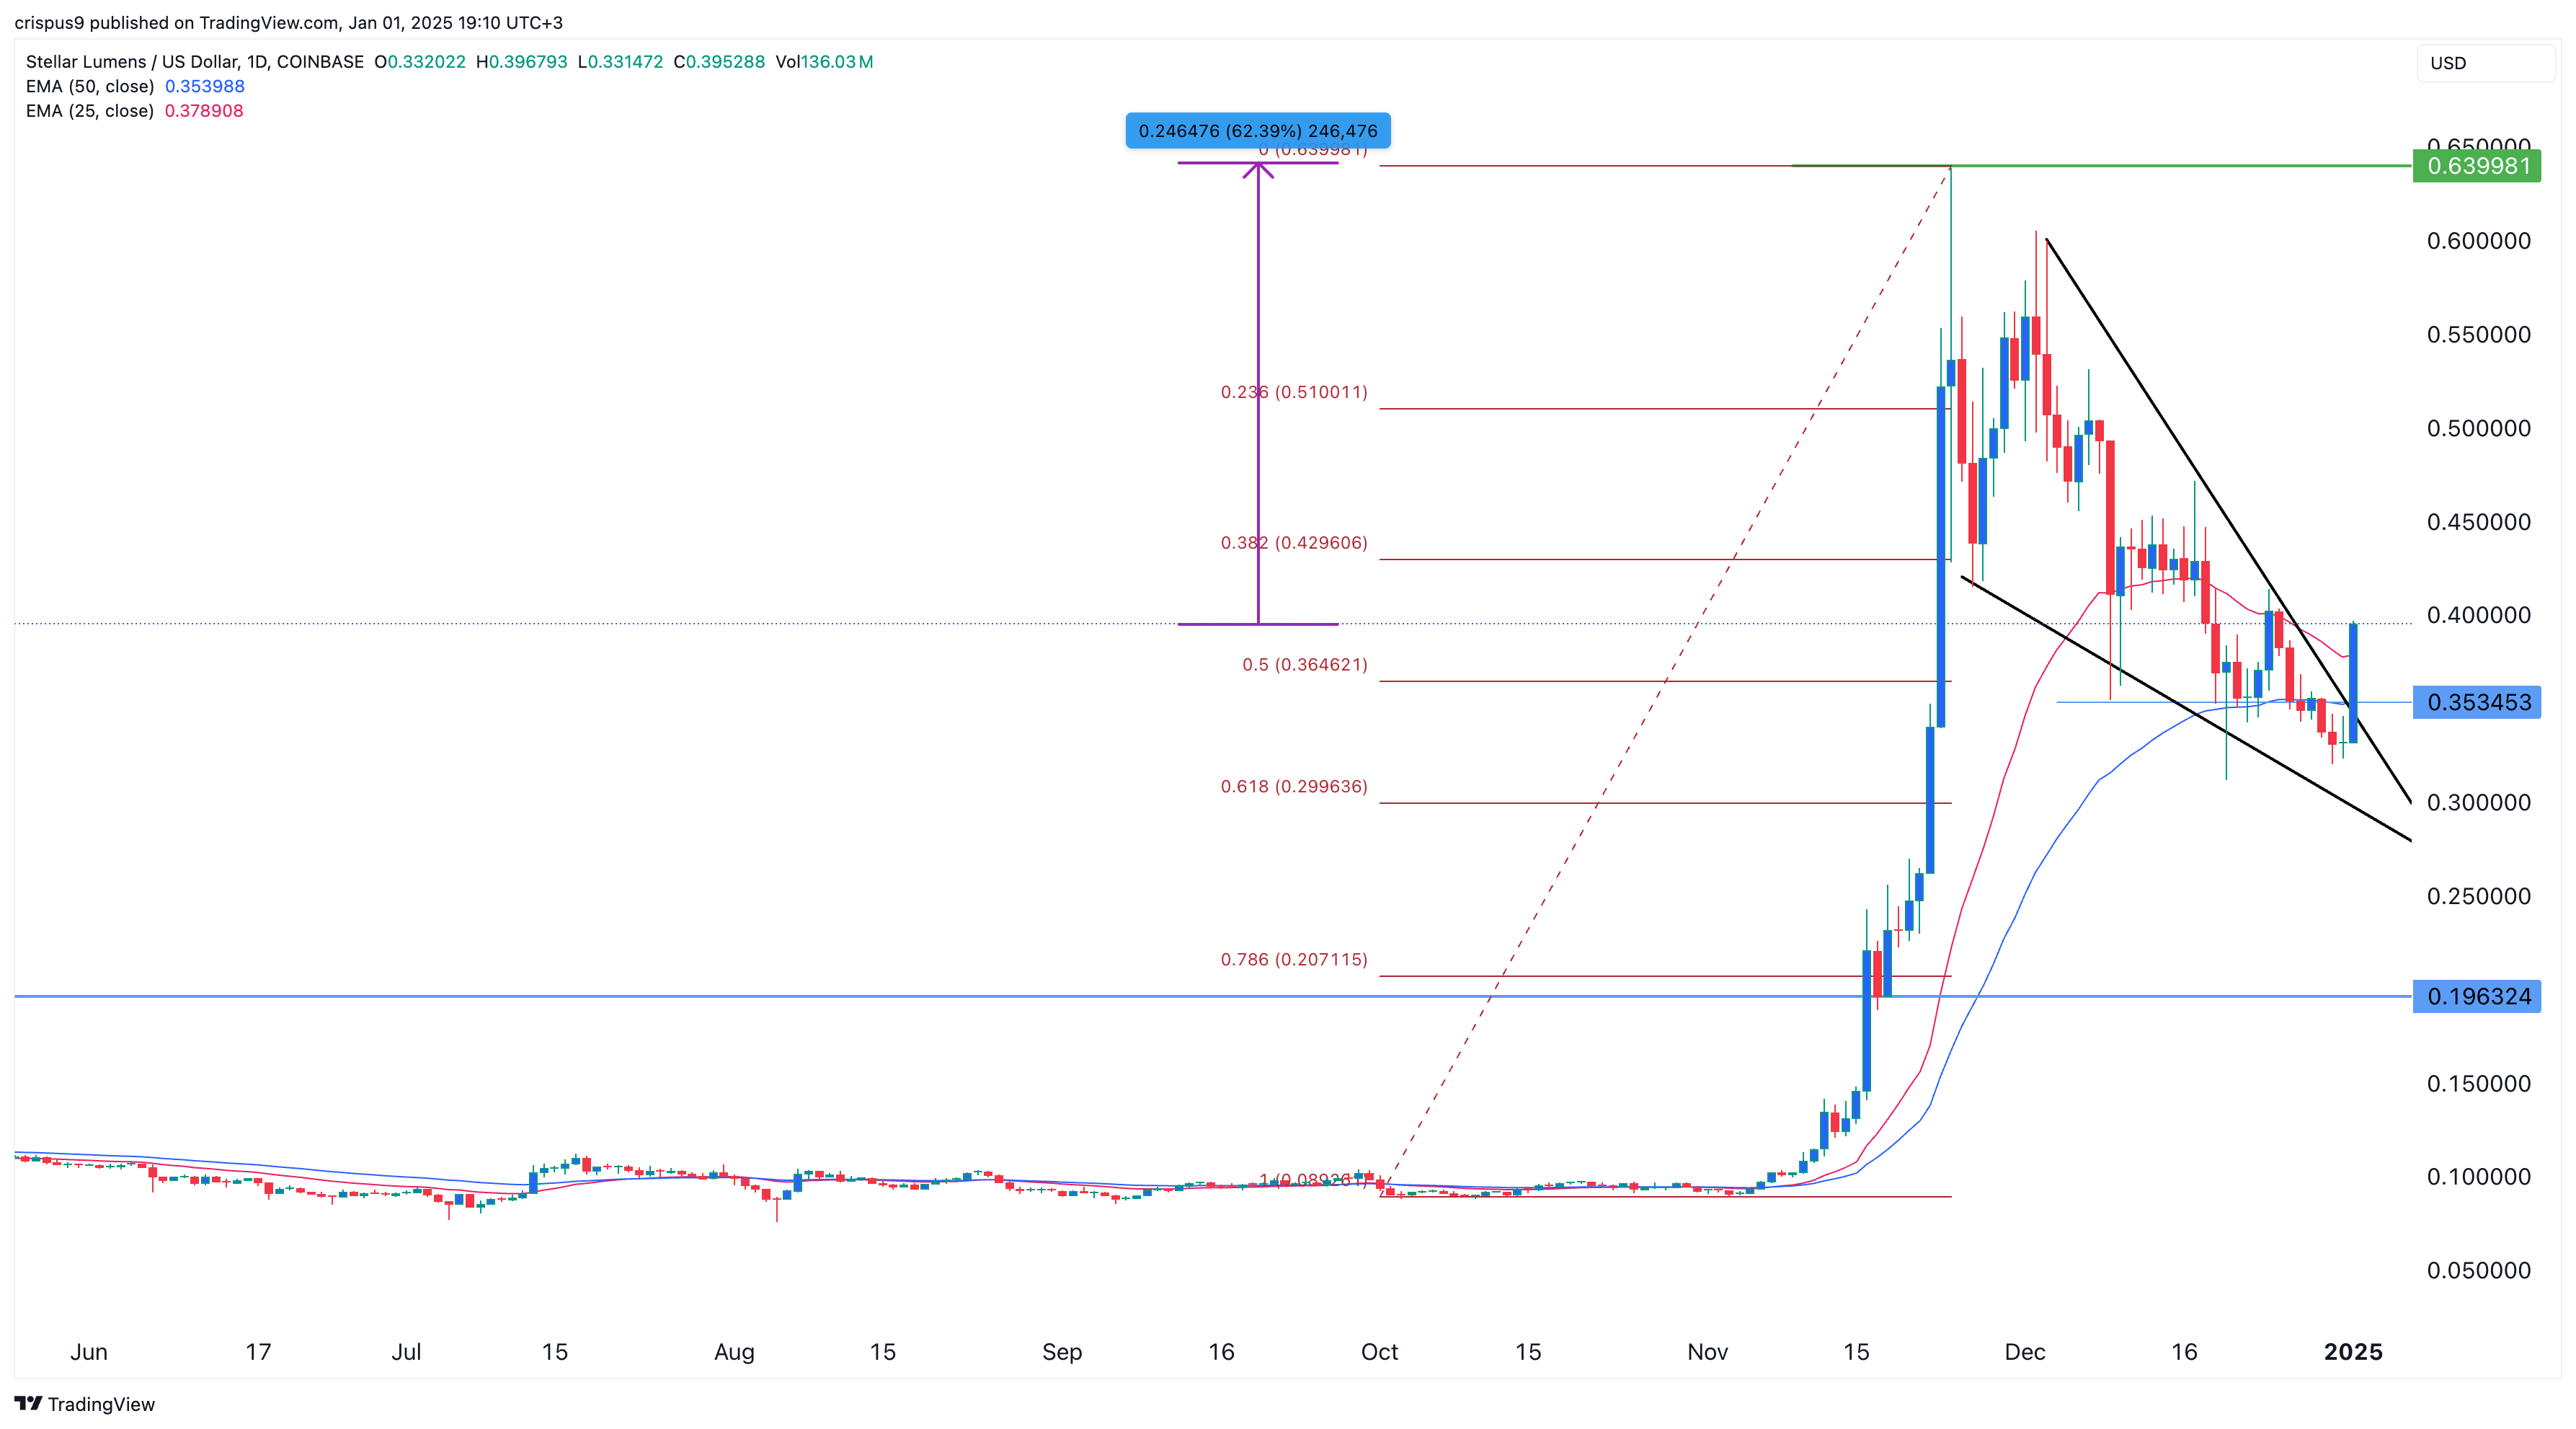
Stellar lumens price formed a God candle and soared to its highest level over a week as other cryptocurrencies retreated.
Stellar (XLM) rose to $0.3822, up by over 22% from its lowest level this month, bringing its valuation to over $11 billion.
This rally happened as the company’s utility continued this week. In a note on Tuesday, the developers announced a partnership with Fonbnk, a solution that enables frictionless on-ramp solution for digital banking in Africa. It lets anyone with a mobile SIM card to access digital banking solutions using Stellar’s technology.
Stellar’s recovery also happened because of its close relationship with Ripple (XRP), which has formed a bullish pennant pattern, pointing to more gains. The two coins will likely benefit when Donald Trump is inaugurated as the President of the United States later this month.
Ripple hopes that the end of Gary Gensler’s era will usher in a new period of friendly regulations in the crypto industry. One potential victory would be the end of the SEC’s appeal against a ruling in which a judge ruled that XRP was not a security.
There are also odds that the SEC, under Paul Atkins, will approve a spot XRP exchange-traded fund later this year. WisdomTree, a company with over $100 billion in assets, has already filed for one.
Meanwhile, Stellar’s blockchain is still growing. According to Dune, its network has handled over 1.16 million smart contract invocations, up from almost zero in the same period last month. It has done that without having any hiccups.
Stellar price has bullish technicals

The daily chart shows that the XLM price rebounded after forming key bullish patterns. It formed two doji candlestick patterns, a popular reversal signal. A doji is a candlestick pattern made up of a tiny body and an upper and lower shadow, signaling that it opened and closed on the same level.
Most importantly, Stellar has been forming a falling wedge chart pattern. This pattern is made up of two falling converging trendlines and often results into a bullish breakout when the two lines near their tip.
Therefore, the breakout and the subsequent move above the 50-day moving average and the 50% Fibonacci Retracement, points to more gains. That means that the coin may jump to the last year’s high of $0.6400, which is about 63% above the current level.
Read the full article here

