

 impulsive rally remains in progress [Video]")


Solana price’s rally gained momentum as its ecosystem and on-chain metrics continued to perform strongly.
Solana (SOL) token rose and retested the important resistance point at $180, its highest level since July 31. It has surged by 60% from its lowest point on Aug. 8, when most assets dropped due to the unwinding of the Japanese yen carry trade.
Solana has outperformed Ethereum (ETH), its biggest competitor, which has increased by just 20% from its August lows.
This performance is largely driven by Solana’s success in the meme coin industry. Data from CoinGecko shows that all Solana meme coins have accumulated over $11.7 billion in valuation.
Dogwifhat, the largest meme coin in the Solana ecosystem, has a market cap of $2.5 billion. Similarly, Bonk and Popcat both have a market cap of over $1 billion, while Cat in a Dog’s World is nearing that milestone.
Meanwhile, data from Blockworks Research shows that Solana’s Real Economic Value, which consists of transaction fees and maximal extractable value, reached a record high on Oct. 25.
Additional data shows that the Solana ecosystem is thriving. According to DeFi Llama, the total value locked (TVL) has risen by 23% to $6.4 billion in the past 30 days. In contrast, Ethereum and Tron’s TVL have decreased by 2.1% and 11.5%, respectively.
Solana has also become the most dominant player in the decentralized exchange industry this month. Its DEX networks, particularly Raydium, have handled tokens worth $16 billion, a figure higher than Ethereum and Base combined. Its monthly volume was $41.7 billion, surpassing Ethereum’s $32 billion.
A similar trend has occurred in the derivatives market, where decentralized applications on Solana handled tokens worth $4.6 billion over the last seven days.
Developers favor Solana due to its superior speed and low transaction costs. Data from Dune shows that Solana’s network was used by almost 200,000 users in the last two weeks, significantly higher than Ethereum’s 52,000.
Solana chart points to more gains

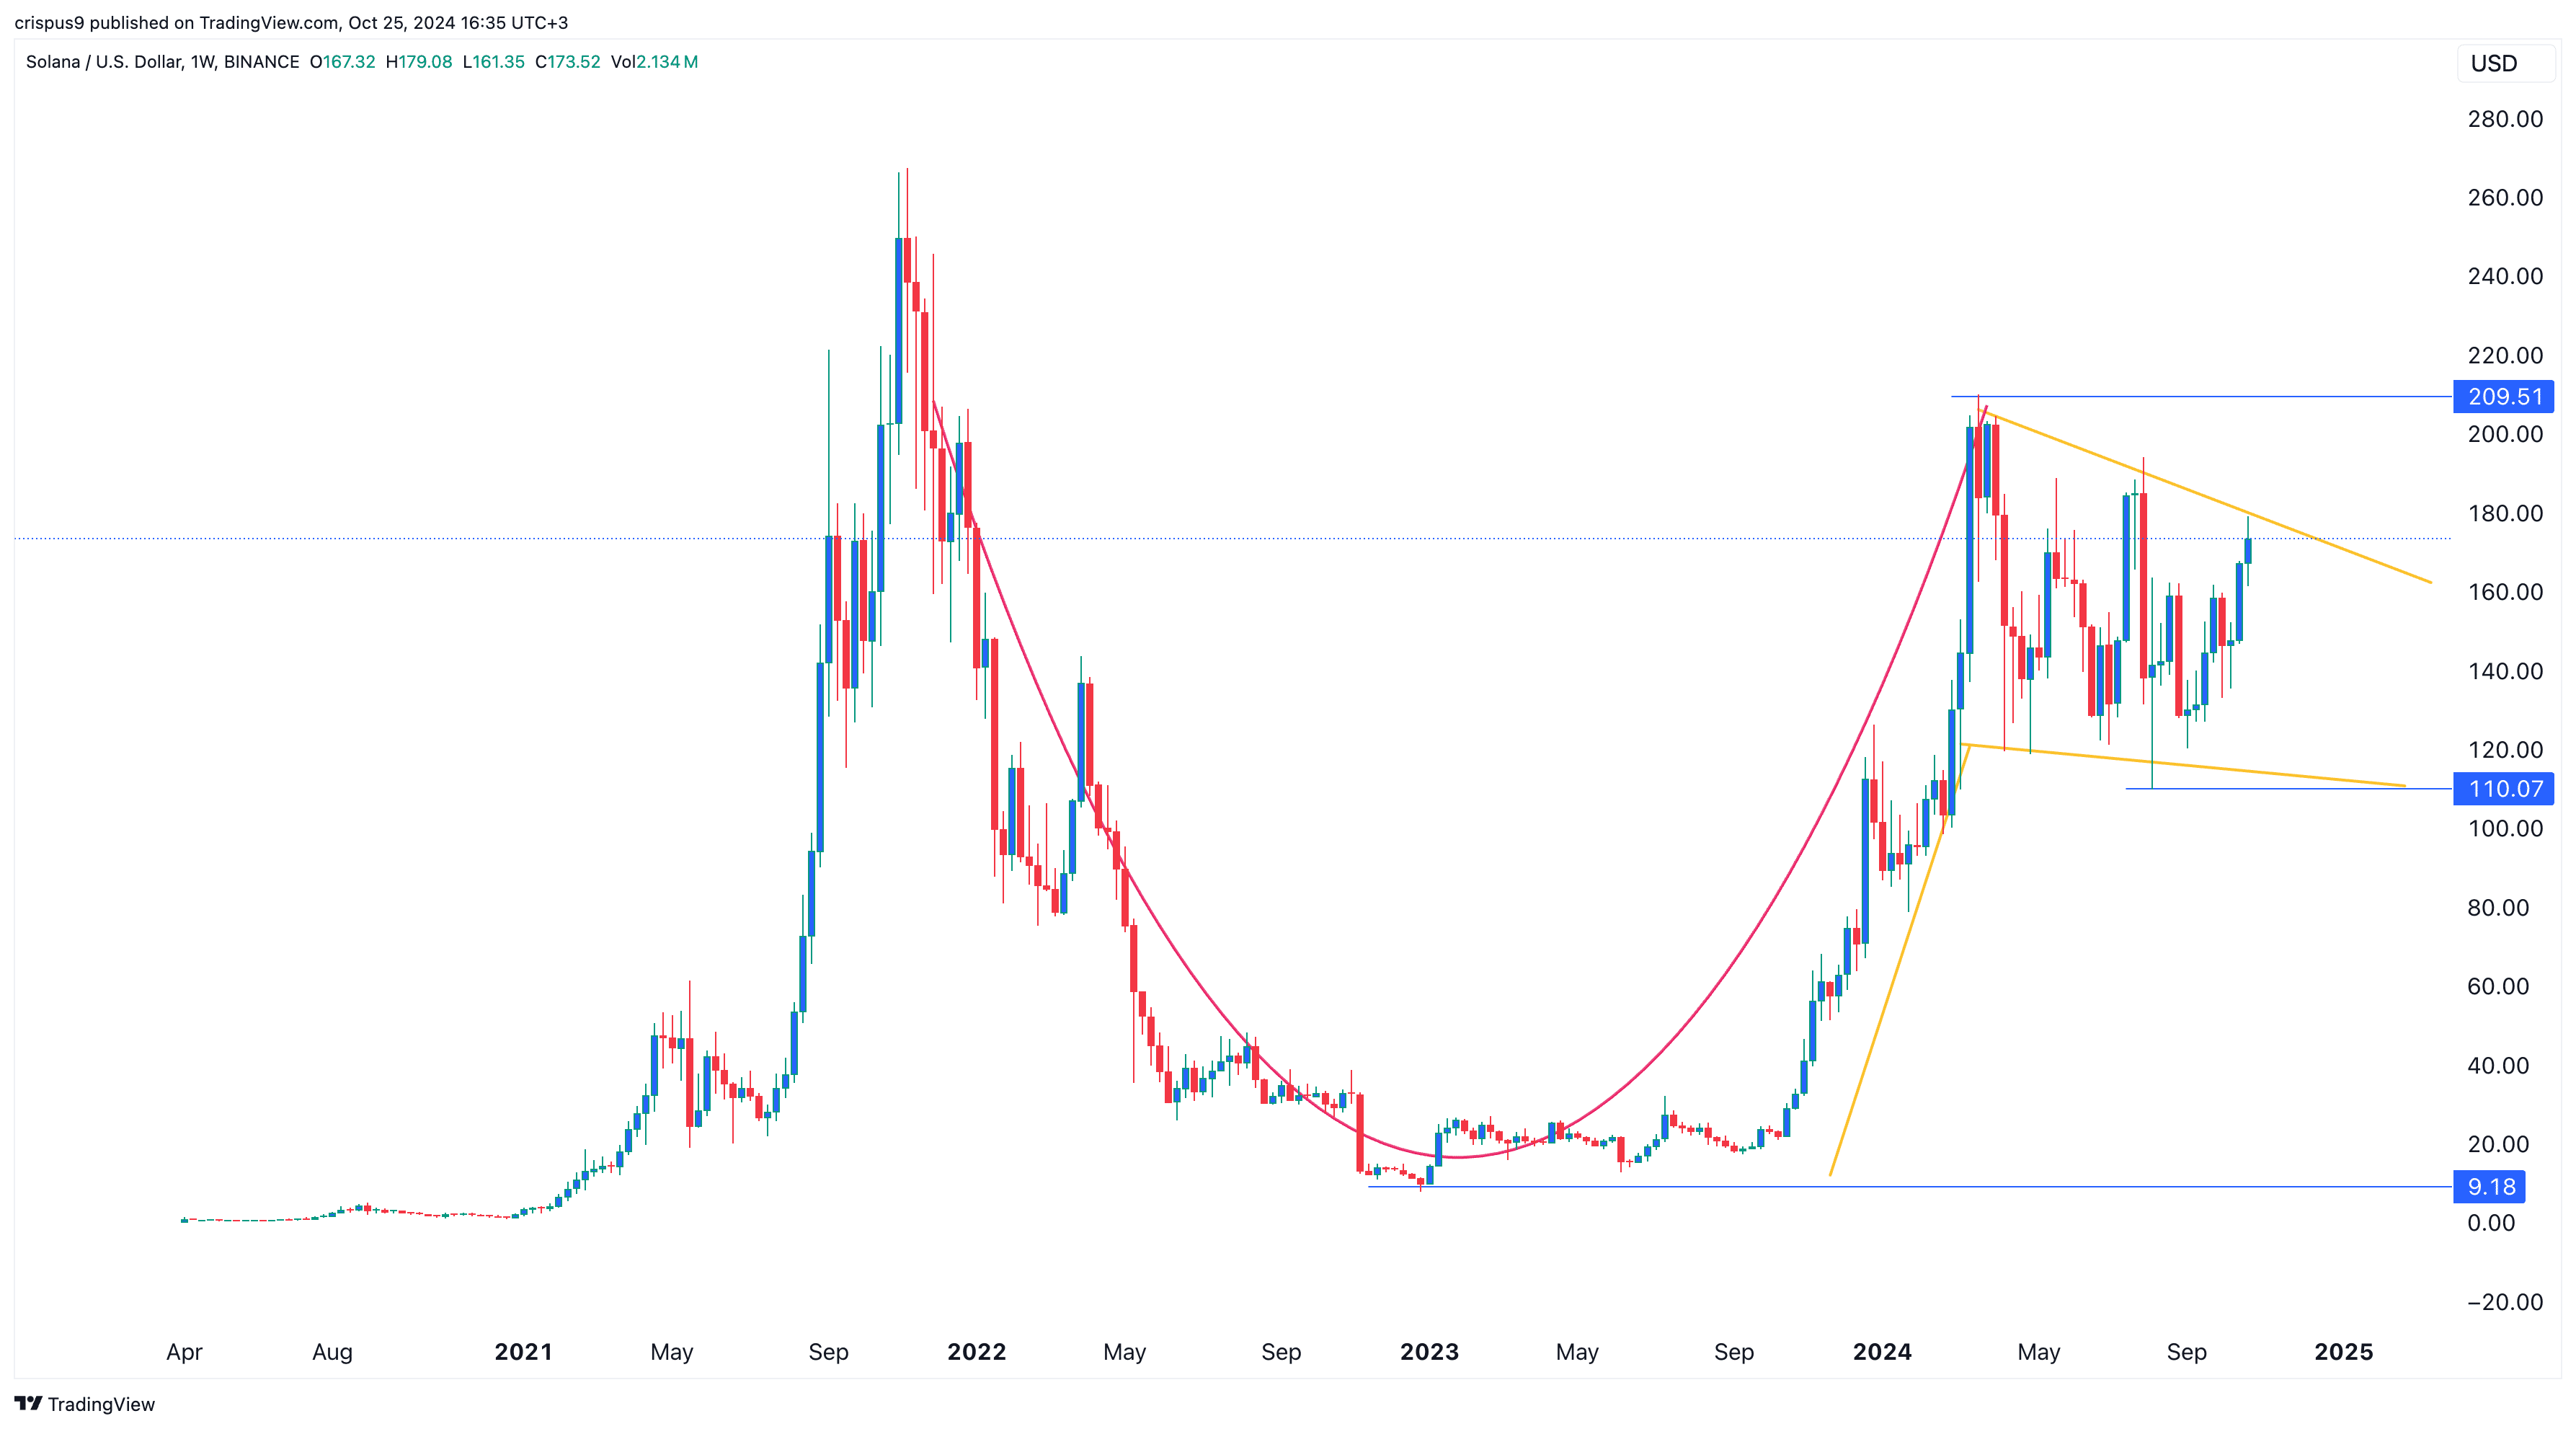
The weekly chart shows that the SOL token has risen for three consecutive weeks amid strong ecosystem growth.
It retested the upper side of the descending trendline that connects the highest swings since March.
Solana has also formed a bullish flag pattern, which often leads to further gains. It has remained above the 50-week moving average and formed a rounded bottom, or cup and handle pattern.
Therefore, the Solana token is likely to have a bullish breakout, with the initial target at $210, about 20% above the current level.
Read the full article here


