


BCH was up over 12% on Oct. 15, ranking as the leading gainer in the market with analysts expecting more gains pointing to several bullish patterns emerging on the BCH chart.
Bitcoin Cash (BCH) surged by 12.9% over the last 24 hours and was exchanging hands at $368 at press time. The crypto asset’s daily trading volume was hovering around $7.26 billion, per data from crypto.news.
Bitcoin Cash, created in 2017 as a hard fork of Bitcoin to address scalability challenges, has historically followed in the footsteps of its predecessor. Periods of significant interest in Bitcoin have often spilled over into BCH, a phenomenon known as the “Bitcoin effect.”
Many market participants view Bitcoin Cash as a cheaper alternative to Bitcoin, offering exposure to a cryptocurrency tied to the original vision of a decentralized peer-to-peer electronic cash system.
The rally coincided with shifting U.S. political dynamics, as polling trends leaned toward Republicans, who are seen as more open to cryptocurrency regulation, boosting positive sentiment around Bitcoin Cash and driving a $750 million increase in its market cap over the past 24 hours.
Technicals point to more gains
Data from CoinGlass shows open interest in BCH futures has risen over the last 7 days from $180 million on Oct. 9 to $236.8 million at press time. A rise in open interest suggests growing investor activity and increased capital flow into Bitcoin Cash futures, indicating heightened speculative interest in the asset.
Community sentiment around BCH was on the bullish side, with 98% of 23,017 traders on CoinMarketCap expecting short-term price gains. Similarly, sentiment on X has also turned positive, with several analysts and traders predicting strong upward momentum for the altcoin.
Pseudo-anonymous analyst Dom noted in an Oct. 15 X post that the BCH price action looks promising having broken out of a falling wedge pattern, a popular indicator for bullish reversal. He predicted that following the break above $350, BCH there’s a high chance that the cryptocurrency could move higher towards $430, 17% above its current price.
Another analyst highlighted that BCH is gearing up for a strong breakout from a symmetrical triangle pattern. Traders view this pattern as a bullish indicator if the breakout occurs on the upside, as it often signals that the prevailing trend—here, an upward trend—will likely resume. Based on this, the analyst expects a potential price surge of 30-40% from current levels.
Meanwhile, analyst Javon Marks has set an even more bullish long-term target for BCH, predicting its price could soar by over 900%, reaching $3,745.
On the 1-day price chart, BCH has decisively broken above its upper Bollinger Band, indicating a strong surge in buying pressure. Simultaneously, the Moving Average Convergence Divergence has formed a bullish crossover, signaling the possibility of accelerated upward momentum.

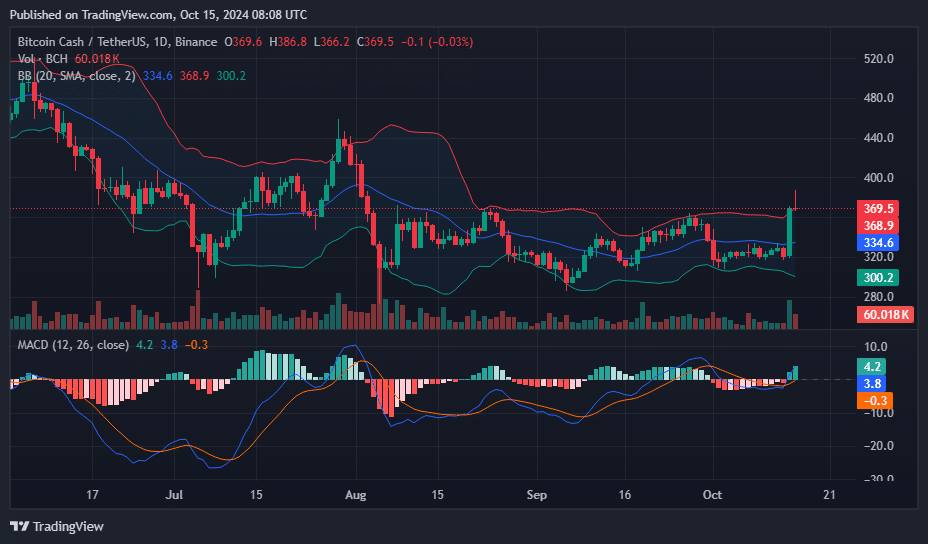
These indicators point to a potential for more gains, suggesting the bullish trend may continue to strengthen in the short term.
Read the full article here


