The global cryptocurrency market capitalization surged by an impressive 16.3% last week, reaching a record high of $3.2 trillion and gaining $430 billion in valuation for the week.
Bitcoin (BTC) led the charge, achieving a new all-time high above $93,000. Here are some of last week’s other standout performers to watch:
XRP finally reclaims $1
After underperforming at the start of the market uptrend two weeks ago, Ripple’s XRP (XRP) staged an impressive solo rally last week, closing with a remarkable 100% gain and solidifying its position among the top performers.
The asset began the week trading below the critical $0.60 mark, following a dip from a $0.57 high days earlier. However, it gained momentum amid the market rally, surpassing $0.60 on Nov. 11.
Defying a slowdown in the broader market, XRP continued its upward trajectory, breaking through the $1 barrier on Nov. 16 for the first time in three years. The rally peaked at $1.26 before facing a pullback, though XRP managed to hold above $1, ending the week at $1.12.
Should the pullback persist this week, traders should monitor the upper Bollinger Band at $0.9980, as a drop below this level could signal further downward pressure.
XLM rallies 115%
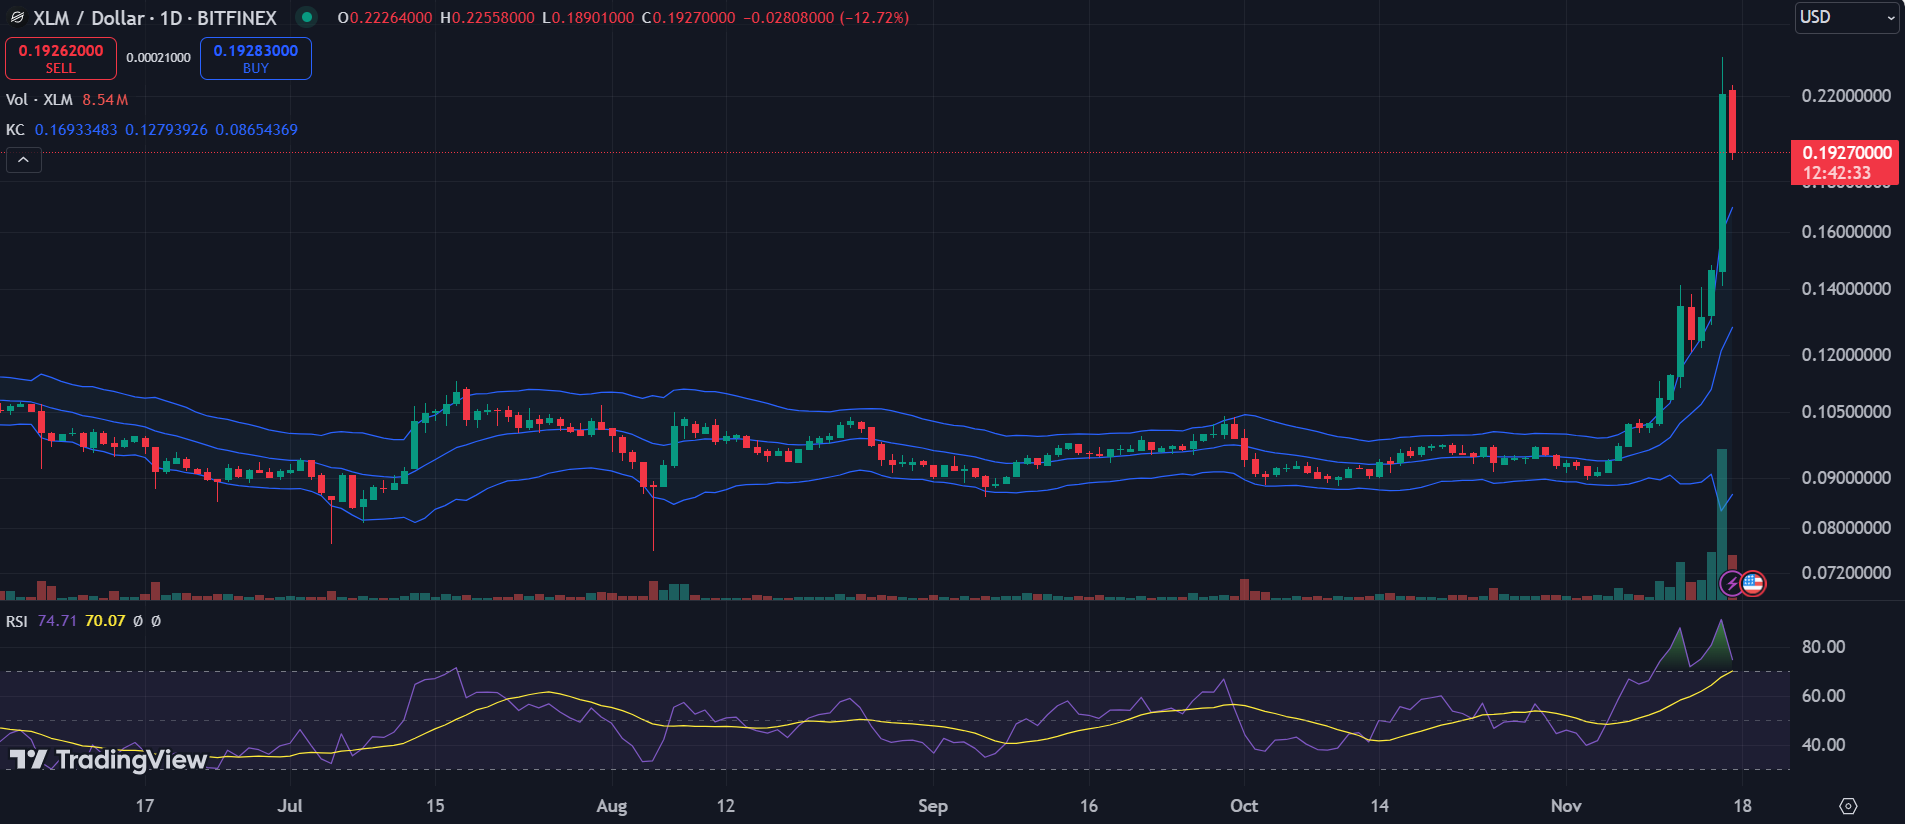
Stellar (XLM), which often mirrors XRP’s price movements, delivered an equally impressive rally last week, recording a staggering 115% surge by the week’s close.

The majority of these gains were realized on Nov. 16, with XLM posting a 50.95% increase. This upward momentum was triggered by a breakout above the upper boundary of the Keltner Channel on Nov. 15, propelling XLM past the $0.13 mark.
However, the new week has seen XLM facing a sharp 12% decline, accompanied by a drop in its RSI, signaling weakening momentum.
Despite this, the RSI remains at 75, indicating it is still in oversold territory. For now, bulls remain in control as long as XLM holds above the upper Keltner Channel boundary at $0.1693.
LTC knocks at $100
Litecoin (LTC) initially trailed in the broader market uptrend but experienced a significant rally last week, breaking through the $70 range. The asset initially spiked to $80 on Nov. 11 before retreating to $71 two days later.
A subsequent recovery pushed LTC above $90 for the first time since May, reaching a seven-month high of $98 on Nov. 16. However, resistance at the critical $100 level halted further gains.
LTC ended the week with a solid 29% gain but has since declined by 8.36% in the new week. The rally was partly fueled by a surge in social media mentions, as the Litecoin community humorously explored a pivot to meme coin status.
Currently trading at $87.58, LTC finds immediate support at the 38.2% Fibonacci retracement level around $85.64. If this level is breached, the next line of defense lies at $81.57 to prevent a drop below $80.
On the upside, Litecoin needs to clear $90.67 to regain bullish momentum.
Read the full article here

