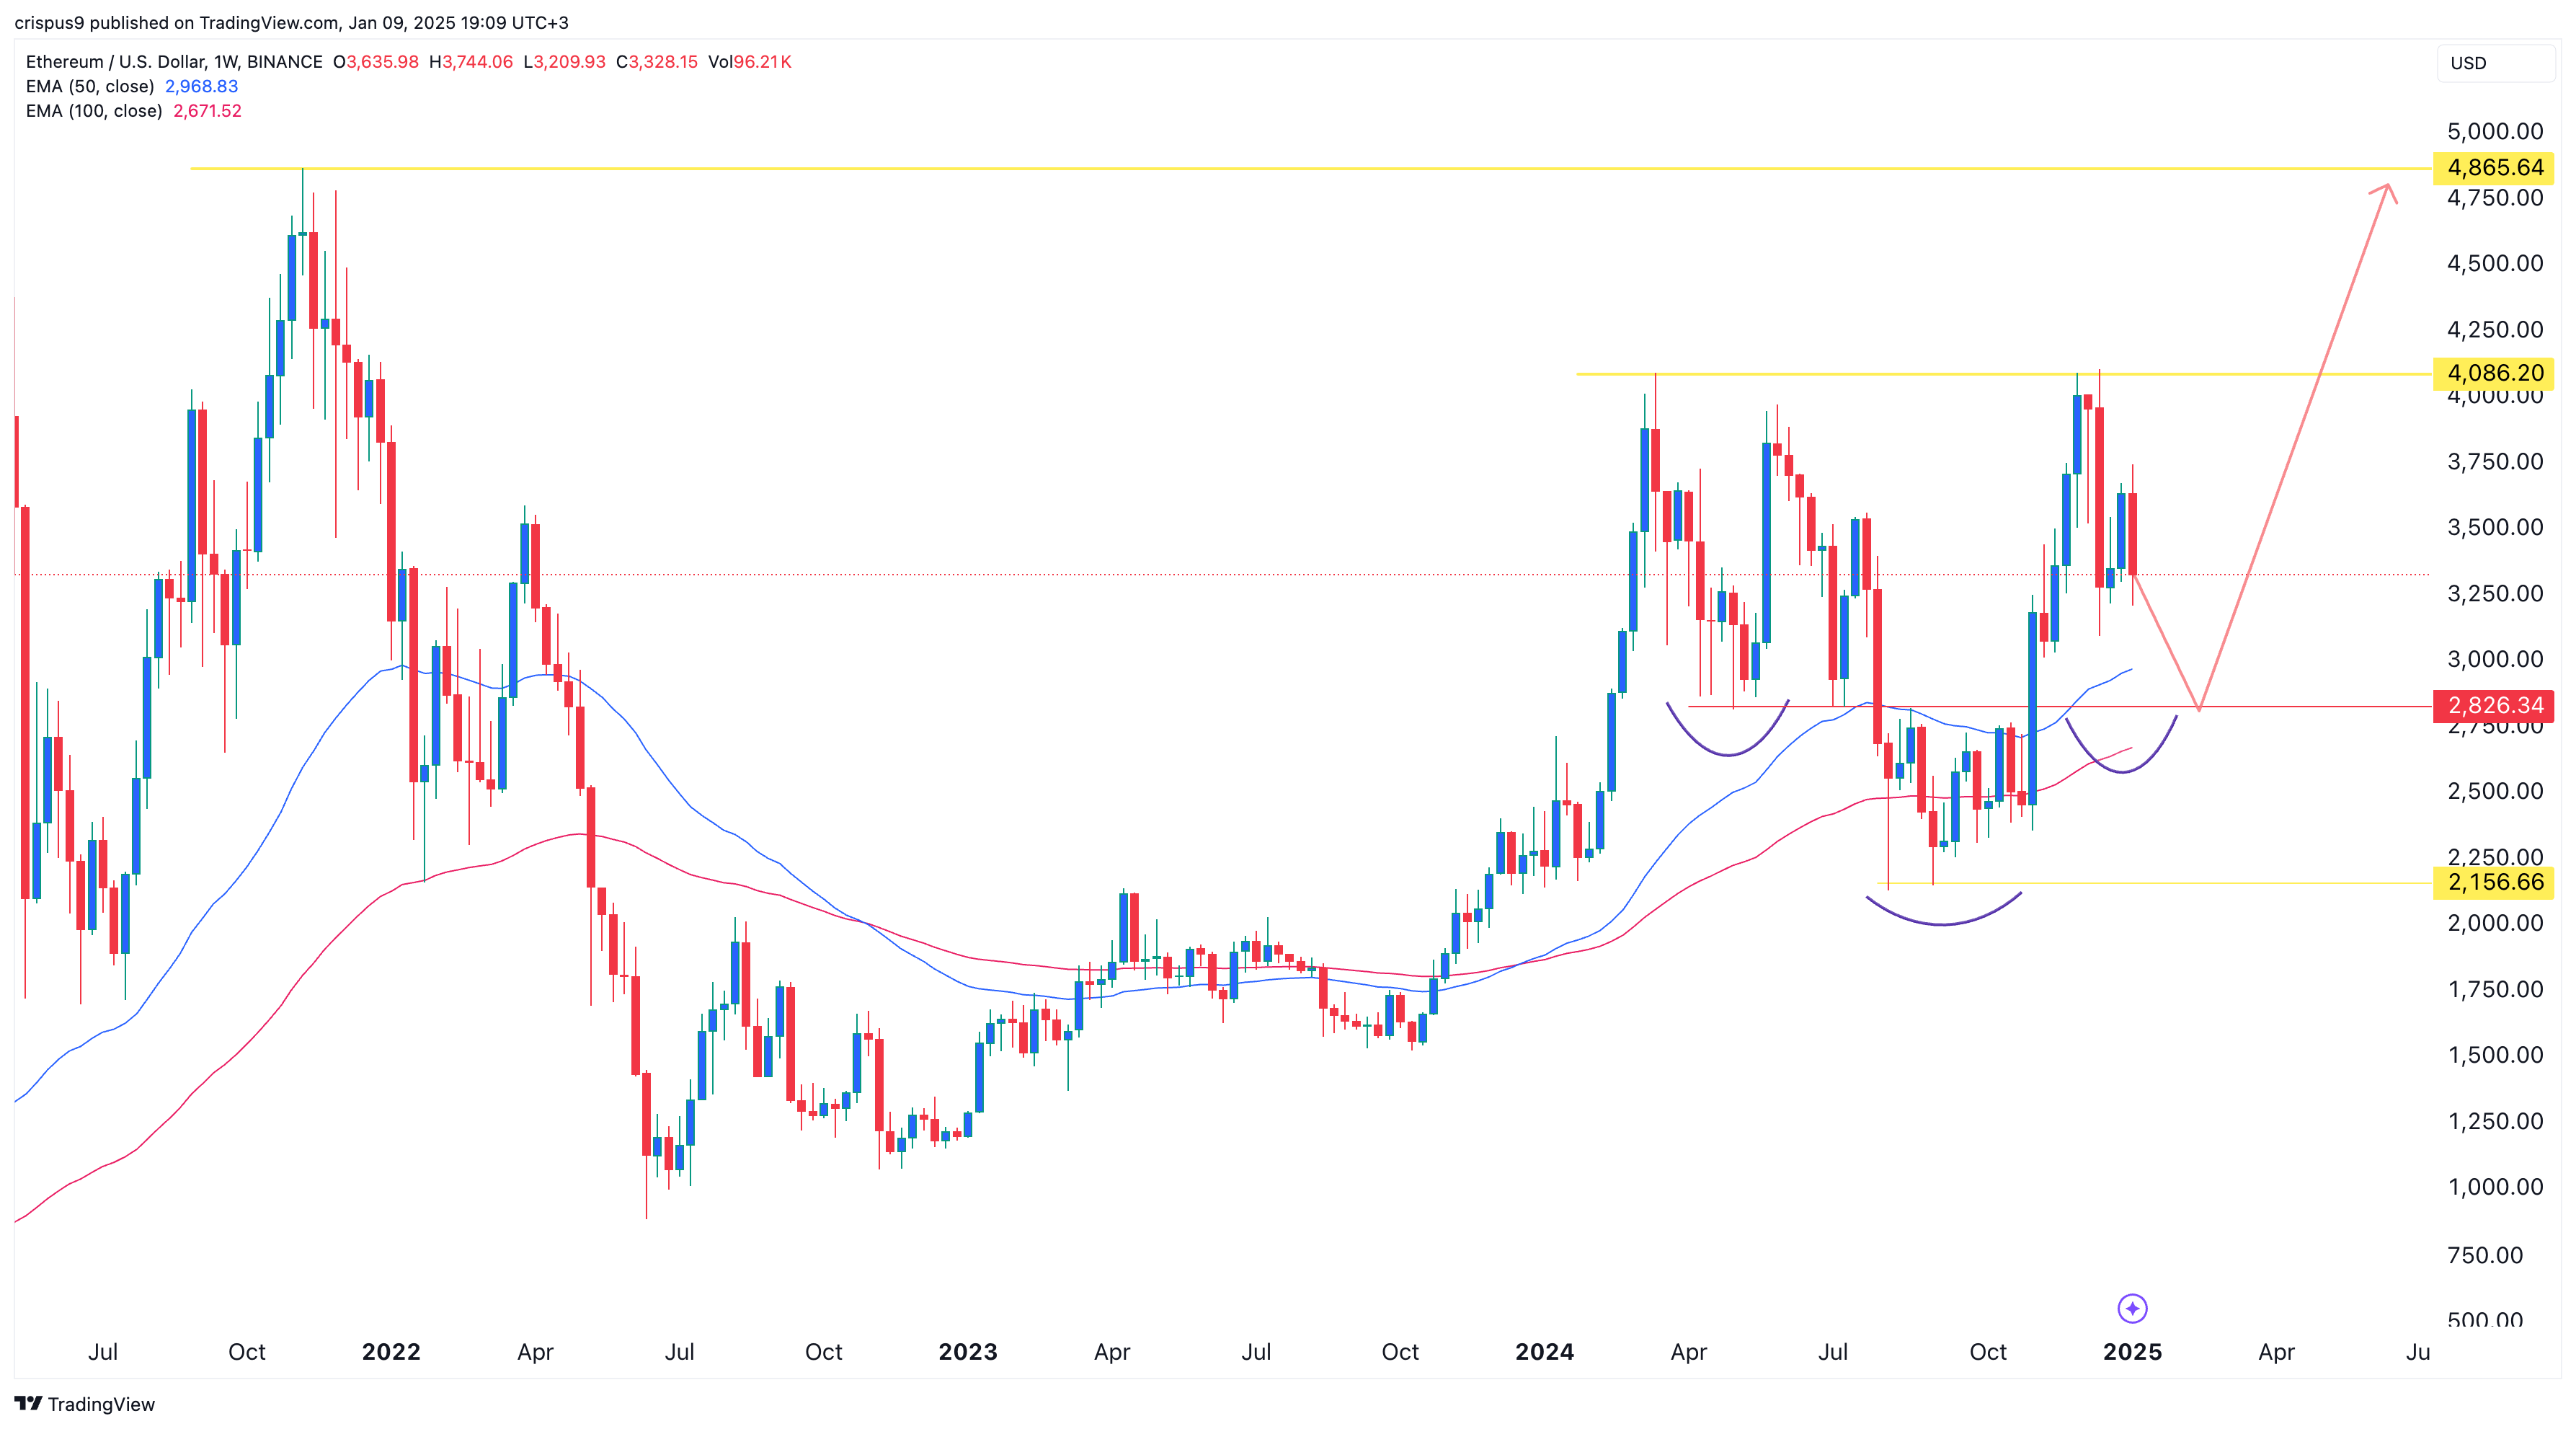
Ethereum’s price has dropped sharply this year after encountering substantial resistance at the $4,000 level in December.
Ethereum (ETH) has declined by nearly 20% from its December high, coinciding with an ongoing sell-off in Bitcoin and other altcoins.
The downturn has been partly attributed to outflows from Ethereum spot exchange-traded funds. On Wednesday, these funds saw net outflows of $159 million, following $86 million the previous day. However, despite recent outflows, Ethereum ETFs have attracted a net inflow of $2.5 billion since their approval in 2024.
ETH’s decline has also coincided with a rise in exchange balances. According to CoinGlass, the number of ETH held on exchanges rose to 15.85 million on January 9, up from 15.3 million on December 30. An increase in exchange balances often indicates that investors are liquidating their holdings.
From a macroeconomic perspective, ETH has been impacted by surging U.S. bond yields amid a hawkish Federal Reserve stance. The 30-year bond yield climbed to 4.96%, its highest level since October 2023. Short- and medium-term bond yields have also continued to rise.
Rising yields suggest that the market expects the Fed to maintain its hawkish approach due to persistent inflation concerns.
Ethereum price analysis

The weekly chart shows that ETH encountered significant resistance at the $4,000 level, which it has struggled to surpass since March of last year.
Despite the recent pullback, the cryptocurrency remains above the 50-week and 100-week moving averages, indicating that bulls still maintain some control.
Most notably, Ethereum is gradually forming an inverse head and shoulders pattern, a widely recognized bullish reversal signal. The “head” is at $2,155, while the “left shoulder” formed at $2,825. As long as ETH stays above the shoulders at $2,825, the bullish outlook remains intact.
A confirmed breakout would occur if ETH moves above the neckline at $4,085. If this happens, the next levels to watch are the all-time high of $4,865 and the psychological milestone of $5,000. However, a drop below the right shoulder at $2,825 would invalidate the bullish view.
Read the full article here

