


Popcat and Bonk’s prices held steady as sentiment in the cryptocurrency industry waned, with Bitcoin falling to $66,500.
Bonk (BONK), the first meme coin on the Solana (SOL) ecosystem, retreated for three consecutive days, reaching a low of $0.000022. It remains 53% below its highest point this year.
Popcat (POPCAT) token held steady at $1.40, a few points below its year-to-date high of $1.5600. It has been one of the best-performing cryptocurrencies this year, having surged by 32,200% from its lowest level in 2024.
Recent data from Nansen shows that Bonk and Popcat have experienced a substantial increase in centralized exchange outflows. Bonk recorded CEX outflows of $5.65 million, 7.25x higher than the recent average.
Similarly, Popcat’s outflow was $3.4 million in the last 24 hours, 2.15x higher than the recent average. CEX outflows are generally considered positive, as they typically indicate that investors are interested in holding the token for a while. Inflows to exchanges, on the other hand, usually suggest that holders want to sell their tokens.
Popcat is ripe for a bullish breakout
On the daily chart, Popcat has performed well in recent months, soaring to a record high of $1.5535 in October.
The token has remained above the 50-day and 100-day moving averages, a positive sign. It has also formed a bullish pennant pattern, which consists of a long vertical line and a symmetrical triangle pattern.
Therefore, Popcat is likely to have a bullish breakout, potentially pushing it to its all-time high of $1.5535, which is about 10% above the current level. More gains will be confirmed if the token rises above this resistance point. If that happens, it could climb to the psychological level of $2.
Bonk has formed a symmetrical triangle

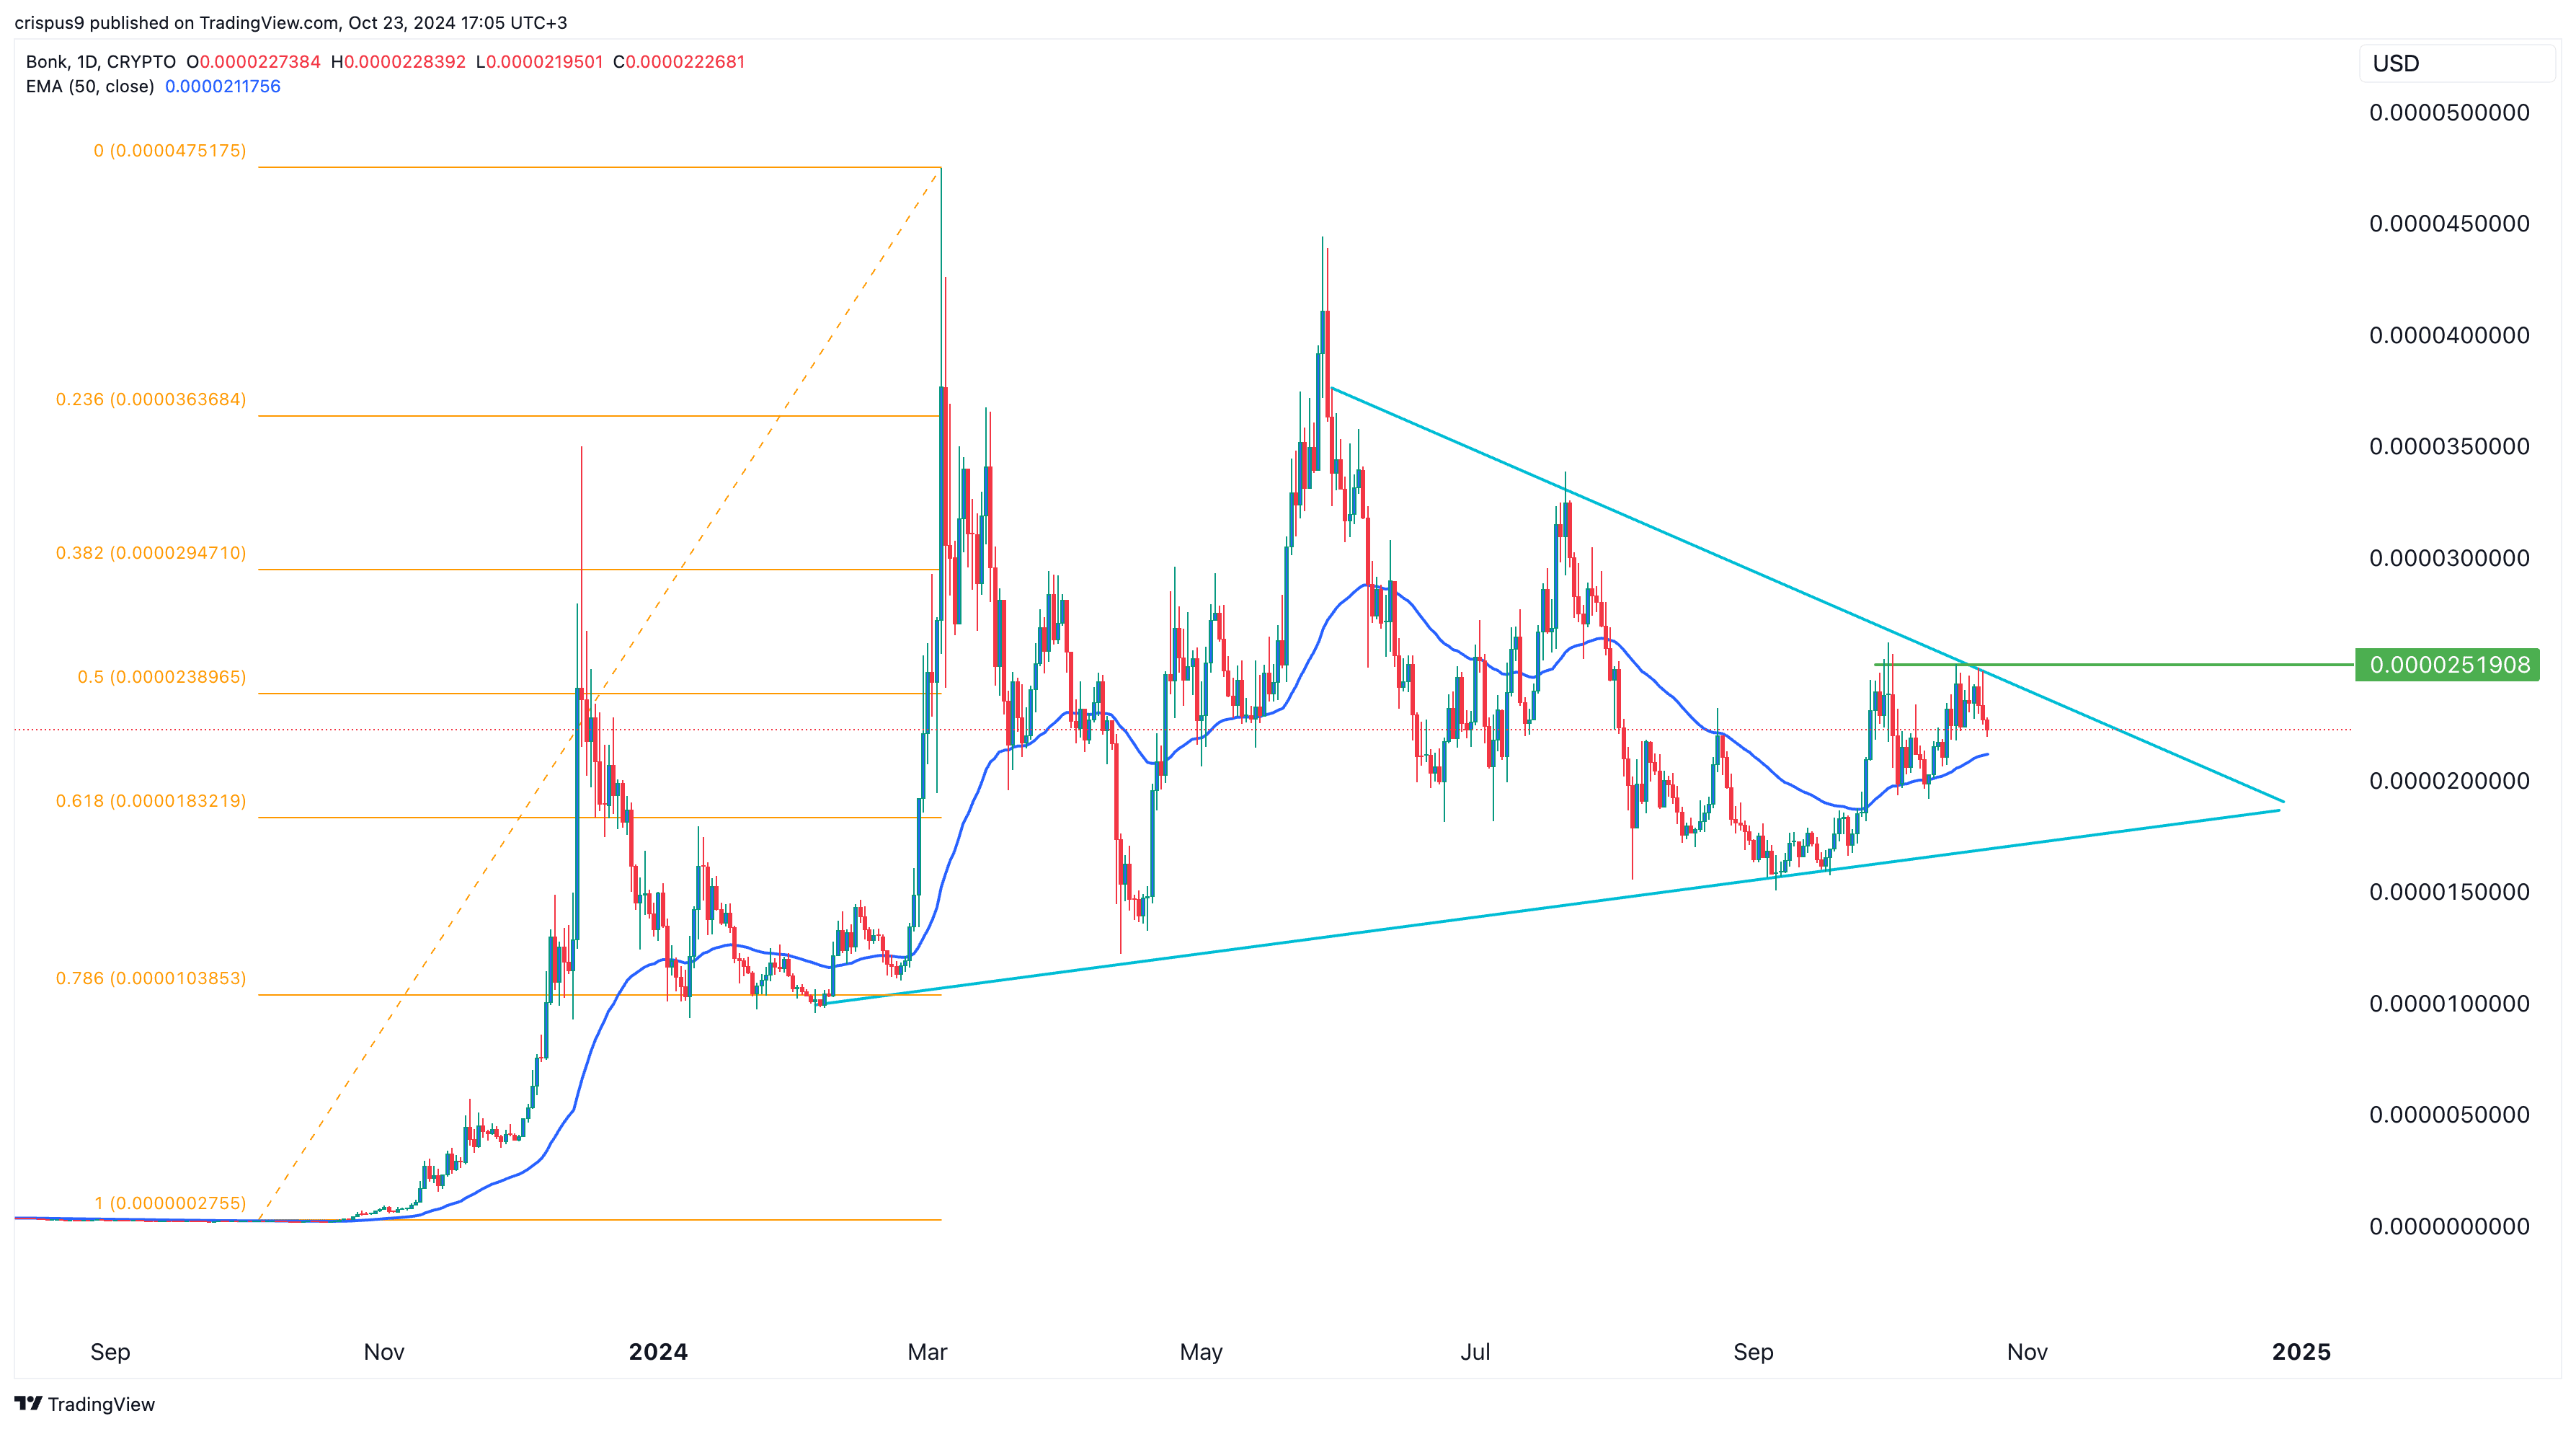
The Bonk token has remained in a tight range in recent days after forming a double-top pattern at $0.000025. A double-top is one of the most bearish signals in the market.
The upper side of the pattern coincides with the upper side of the symmetrical triangle that has formed over the past few months. This pattern is nearing its confluence level, indicating that significant moves could occur in the coming days.
A break above the double-top at $0.000025 would point to more gains, while a drop below the 50-day moving average at $0.00002117 would signal further losses ahead.
Read the full article here


