


Bitcoin’s rejection at $66K and the break below the 200-day moving average suggest that bearish sentiment is gaining strength.
If the price fails to hold the $60K support, the likelihood of a mid-term decline toward the $52K-$55K zone increases.
Technical Analysis
By Shayan
The Daily Chart
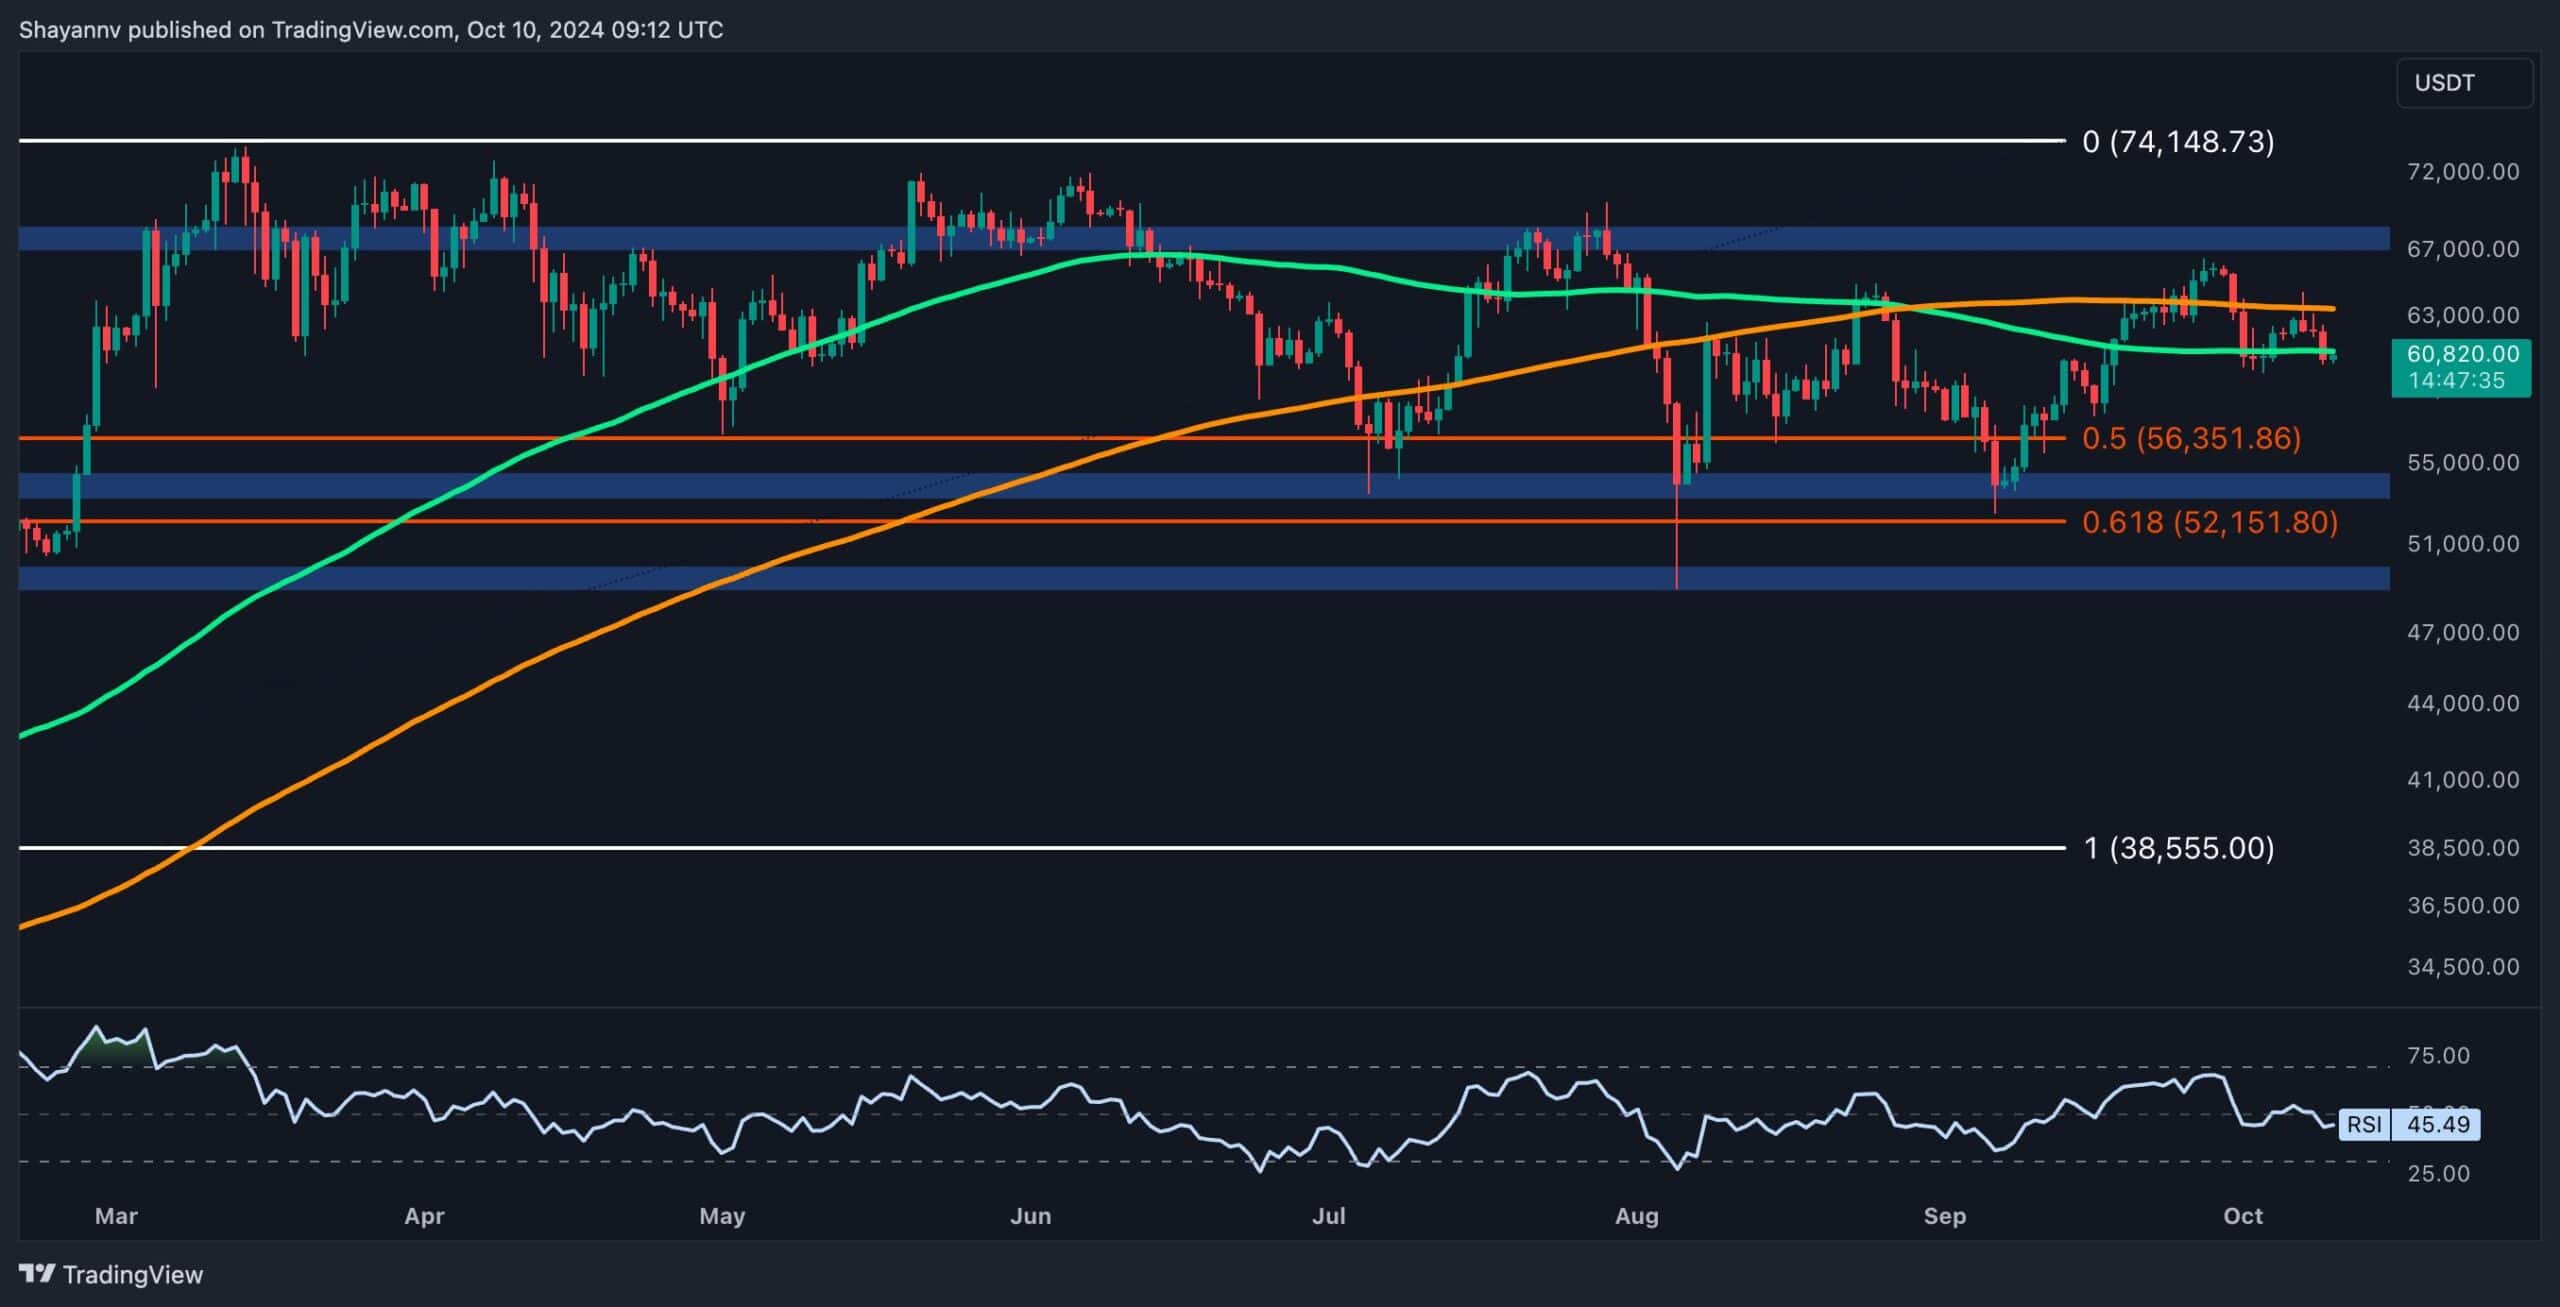
On the daily chart, Bitcoin’s surge above both the 100-day and 200-day moving averages briefly revived bullish sentiment.
However, upon reaching the $66K resistance zone, substantial selling pressure emerged, halting the uptrend. This area has historically served as a robust multi-month resistance, and Bitcoin’s failure to surpass it resulted in a significant rejection.
Currently, Bitcoin is trading below the 200-day moving average of $63.4K and resting on the 100-day moving average of around $61K. This zone is critical, as the $60K support region is both psychological and substantial.
If Bitcoin breaks below this barrier, a mid-term decline toward the $52K-$55K range becomes likely. This area represents the next major support level and could be the target if bearish momentum continues.
The 4-Hour Chart
On the 4-hour chart, Bitcoin’s surge was met with heavy resistance in the 0.618-0.786 Fibonacci OTE retracement zone, which corresponds to the $66K price level.
This selling pressure led to a sharp rejection, resulting in a 10% decline. The presence of sellers near the $66K level indicates that it remains a formidable barrier, acting as a key resistance level in the broader market outlook.
As a result, Bitcoin is expected to enter a short-term consolidation phase, with the $60K psychological support being the next crucial level to watch. If Bitcoin holds above this support, it may consolidate before attempting another upward move. However, if the $60K support is breached, a deeper retracement toward the $55K level becomes highly probable, marking a potential shift to a sustained bearish trend.


On-chain Analysis
By Shayan
The Bitcoin Coinbase Premium Index is a key indicator that helps assess whether U.S. institutional investors or large traders are actively buying or selling BTC on Coinbase compared to other exchanges. Currently, the index shows negative values, indicating a bearish sentiment in the market, with either significant selling pressure or a pause in accumulation by large investors.
In the short term, this negative premium reflects a lack of demand from U.S.-based institutional investors, contributing to bearish market sentiment. However, this period of low sentiment for long-term holders can often present attractive buying opportunities. From a broader perspective, while the market is still moving within a descending trend channel, both accumulation and selling pressure seem to be tapering off.
This suggests a period of market indecision where neither bulls nor bears have a firm grip on the direction of price action. As a result, this is not an ideal time for short-term trading, as the lack of a clear trend introduces increased risk.


Read the full article here


 Trade Into $22 Million Says This Ethereum Presale Will Explode 14,000X This Winter | Bitcoinist.com")
")

