Este artículo también está disponible en español.
An analyst has explained why Bitcoin could end the year 2024 inside the $108,000 to $155,000 range if history repeats for the asset.
Bitcoin Performance Has Been Similar To Last Two Cycles So Far
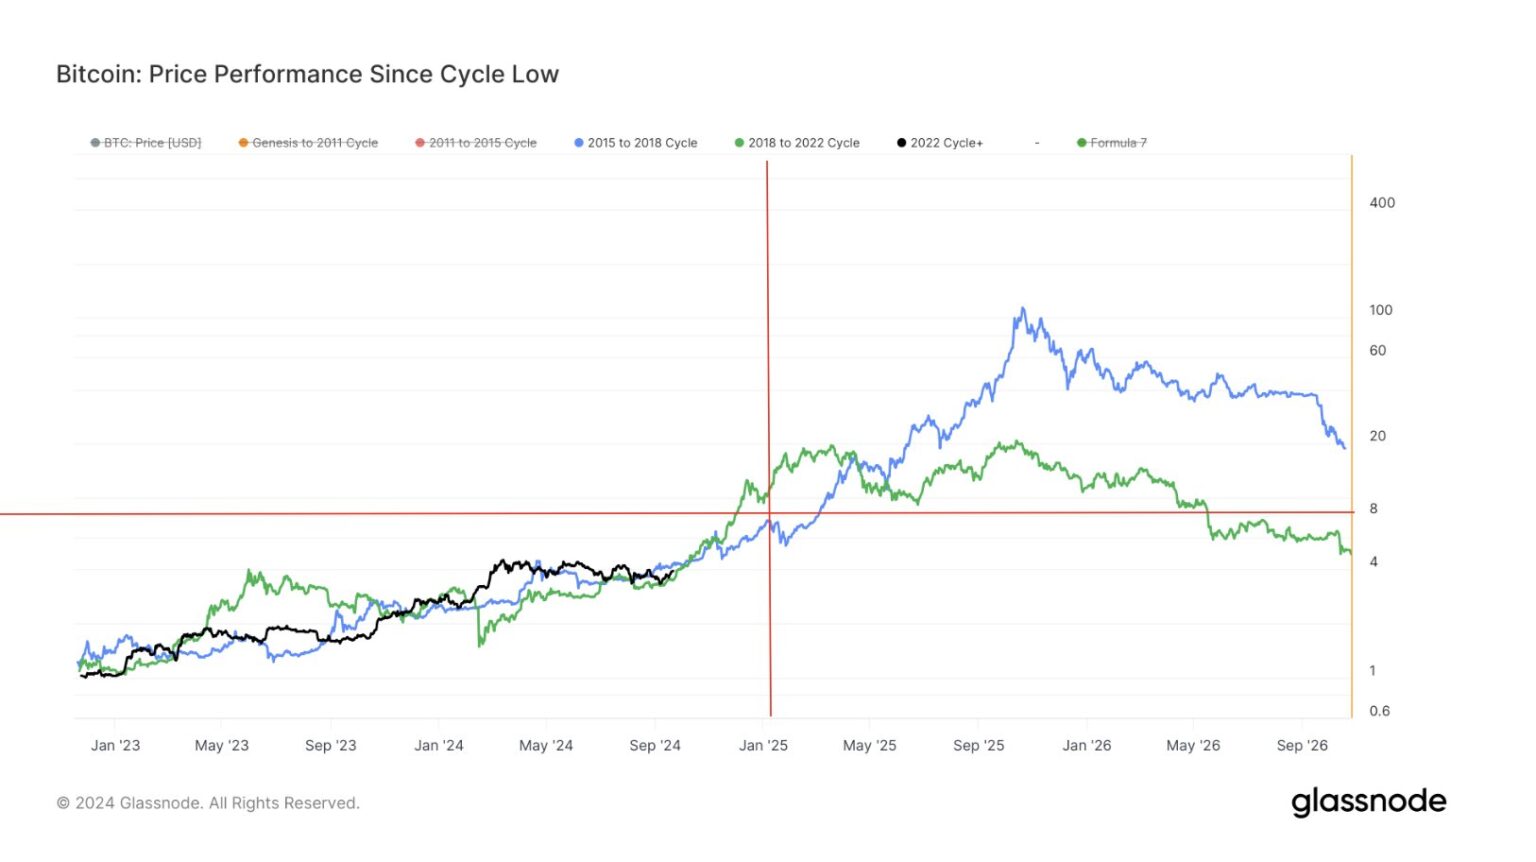
In a new post on X, analyst James Van Straten has discussed about the BTC price performance from the cycle low chart for the last couple of cycles. As its name suggests, this chart captures the price trend between successive cyclical lows. For the latest cycle, the start-point is naturally the bottom that was observed shortly following the collapse of the cryptocurrency exchange FTX back in late 2022.
Related Reading
Below is the chart shared by Van Straten, which shows how this most recent cycle has stacked against the last two so far:
As is visible, the asset’s recent price performance has been remarkably similar to that witnessed in the past two cycles at the same stage. “Out of all the graphs, TA etc, Bitcoin from the cycle low continues to be the most valid,” notes the analyst. Given the similarity so far, it’s possible that the coin’s trajectory in the current cycle may continue to mimic that of the last two.
Van Straten has pointed out that both these cycles finished September higher. Not just that, this is also the point at which the two began a long-lasting surge that culminated into the bull run highs. Thus, it’s possible that Bitcoin may also surge from here, if the current cycle continues to follow the last two.
“If BTC were to finish EOY between the two previous cycles, which it has done for most of the current cycle, we would be looking at 108k-155k,” explains the analyst.
From the latest Bitcoin price, a rally to the lower end of this range, $108,000, would mean an increase of around 70%, while that to the $155,000 upper level would suggest growth of more than 144%.
Related Reading
As always with patterns that depend on history, though, it’s not necessary that BTC would show a rally in this range to end the year. Nonetheless, the analyst says, “if we don’t get a recession, this is entirely possible.”
In some other news, as market intelligence platform IntoTheBlock has pointed out in an X post, Tether’s stablecoin, USDT, has reached a new high in its supply recently.
As displayed in the above graph, the the USDT market cap has witnessed some sharp growth recently. With the metric’s value now nearly at $120 billion, Tether’s token has left the other stablecoins way behind.
The inflows into the stablecoin can actually be relevant to Bitcoin, as capital from USDT generally tends to find its way into the original cryptocurrency. Thus, the growth to a new record suggests the investors potentially have more dry powder available to buy BTC with than ever before.
BTC Price
Bitcoin has gone stale after its recent recovery as its price is still trading around the $63,600 mark.
Featured image from Dall-E, IntoTheBlock.com, Glassnode.com, chart from TradingView.com
Read the full article here

