


A comprehensive analysis of Ripple’s (XRP) price action showed that the token had been confined between $0.49 and $0.53 since January 24. Despite some sideways movement, XRP has flashed a bearish sign, indicating that the token could continue to slip.
Altcoin Daily, a crypto analysis team, also shared a similar sentiment. According to the handle, XRP has lost its support, and a move below $0.50 could be possible in the short term.
XRP just lost support. Every major moving average has flipped.$XRP now hovering just over 50¢.
Are you following? 👈✅ pic.twitter.com/r0HEx7TkaL
— Altcoin Daily (@AltcoinDailyio) January 31, 2024
XRP/USD 4-Hour Analysis
After examining the 4-hour chart, XRP’s bullish prospects were almost non-existent. This is because of the dominance of sellers in the market and the lack of demand.
The Relative Strength Index (RSI) showed that XRP had weakened. At 32.58, the RSI reading confirmed the intense selling pressure going on with the token. With the price falling below the descending channel, XRP could lose critical support at $0.50.
Should this be the case, the price might drop to $0.48. Furthermore, indications from the Awesome Oscillator (AO) showed that XRP was experiencing increasing downward momentum. With the positions of these indicators, bulls might not have the power to resist the decline from $0.50.
XRP/USD 4-Hour Chart (Source: TradingView)
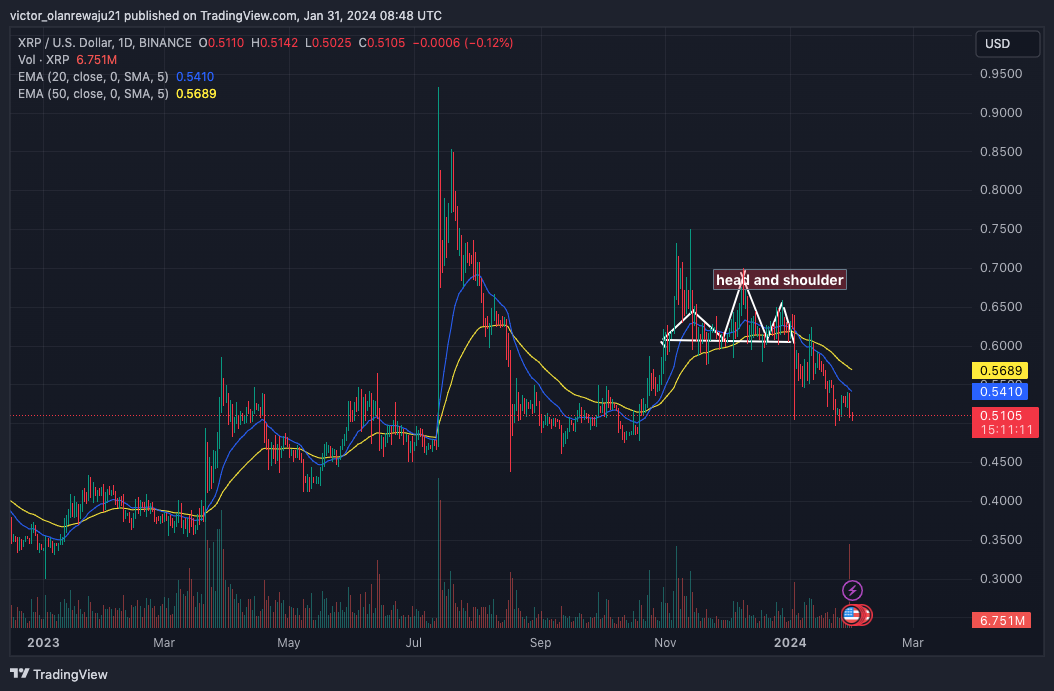
XRP Daily Chart
On the daily timeframe, the market structure was not any better. According to the analysis of the chart, XRP had formed a Head-and-Shoulder (H&S) pattern. This occurred between November 1, 2023, and January 1, 2024.
The H&S pattern is formed when a cryptocurrency’s price hits a peak. After which, it hit a higher peak before dropping to a lower peak. This pattern suggests that the token could move from a bullish structure to a bearish one.
Typically, this leads to a significant correction and could have been responsible for XRP’s 17.19% decline in the last 30 days. However, that might not be the end of the correction because of the Exponential Moving Average Position (EMA).
First, the 50-day EMA (yellow) was at $0.56. Also, the 20-day EMA (blue) was at $0.54. Technically, this position is called a death cross and could foreshadow a clear price decrease.

XRP/USD 4-Hour Chart (Source: TradingView)
Since XRP was unable to break above the EMA line, its price looks ready to fall. From a bearish perspective, XRP could lose another 15%. If this happens, the token’s price would be $0.35. Although unlikely, a bullish reversal could send the price to $0.53.
Disclaimer: The information presented in this article is for informational and educational purposes only. The article does not constitute financial advice or advice of any kind. Coin Edition is not responsible for any losses incurred as a result of the utilization of content, products, or services mentioned. Readers are advised to exercise caution before taking any action related to the company.
Read the full article here


 Signal, Bitcoin (BTC) Crucial $60,000 Resistance Reached")
 Cryptos Outshining This Week")


