Shiba Inu, the popular cryptocurrency, has recently witnessed a significant uptick in its trading value. This shift marks a notable recovery following a prolonged period of depreciation. The Shiba Inu price is valued at $0.000009387, reflecting a 3.56% increase over the past day. The current market capitalization has also escalated by 3%, reaching a total of $5.53 billion.
Moreover, the trading activity surrounding SHIB has intensified. The past 24 hours saw a surge in its trading volume, amounting to $133 million. Despite this, the coin’s journey wasn’t devoid of challenges. After hitting a high of $0.00001125 earlier in the month, a subsequent downturn added an extra zero to its price, underlining the volatility in the cryptocurrency market.
Shiba Inu Price prediction
Shiba Inu price has been upward, buoyed by bullish market sentiment. Over the recent week, the coin’s trading range has oscillated between $0.000009 and $0.000009502. This fluctuation underscores a tug-of-war between the market’s bulls and bears, each vying for dominance in influencing SHIB’s value.
Whale Activity Boosts Shiba Inu’s Market Position
Shiba Inu has witnessed a significant uptick in its on-chain activity recently. Data from IntoTheBlock shows a dramatic 1,173.58% rise in transactions over $100,000 in the last 24 hours. This spike indicates active movement by major SHIB holders, or ‘whales,’ across various platforms. Such substantial transfers drive a bullish trend in the cryptocurrency’s market behavior, reflecting a heightened interest from key investors in Shiba Inu’s prospects.
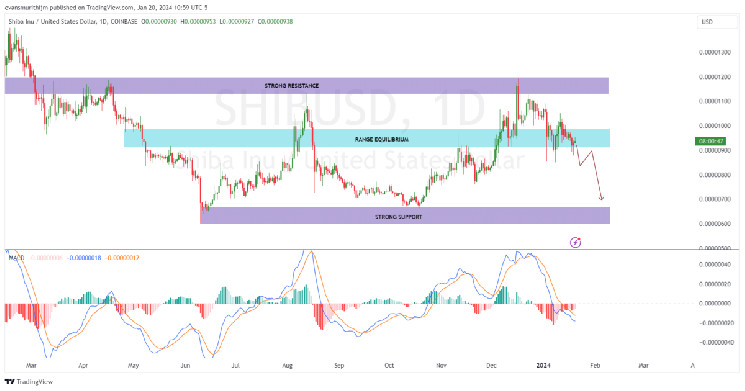
If Shiba Inu manages to break through the initial resistance at $0.00001, market watchers anticipate a potential uptick in its valuation. Climbing past this barrier and scaling the next significant resistance near $0.000015 could set the stage for an upward trajectory toward the $0.00003 mark.
Nonetheless, any stalling at the $0.00001 resistance level might provoke a downturn. Support levels are notably positioned around $0.000009, with a further dip below $0.000008 potentially exacerbating the decline, steering SHIB into a steeper descent.
Technical Indicators Point to a Promising Future for Shiba Inu
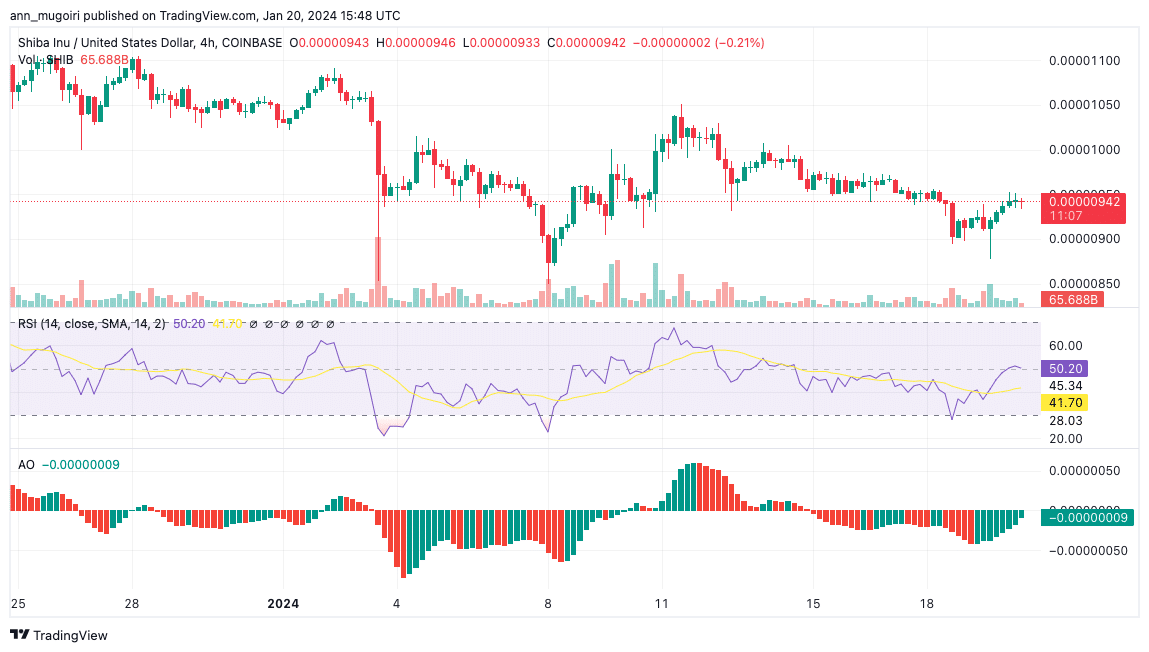
The four-hour Technical indicators lend credence to the optimistic outlook. The Moving Average Convergence Divergence (MACD) indicator is currently positioned favorably, with its line over the signal line on the daily chart complemented by a burgeoning green histogram that underscores a bullish market sentiment indicative of mounting buying activity. Additionally, the Awesome Oscillator’s positive reading of $50.20 echoes a bullish market trend.

Shiba Inu Price Chart: Tradingview
The Relative Strength Index (RSI) on the daily chart indicates a bullish with readings above the 50 level inching closer to the overbought demarcation of 70, Meanwhile, the 50-Smooth Moving Average and the 20-SMA are on an upward trajectory in the daily chart, reinforcing a short-term bullish sentiment but without preempting the market’s next moves.
Related Articles
- Shiba Inu Open Interest Spikes 25% To $18 Mln Amid Price Rally
- Shiba Inu Burn Rate Rockets 1600% As Community Burns 89 Mln SHIB
- Shibarium Nears 300 Million Transactions Amid Daily Count Dip
Read the full article here

