Crypto analyst Michaël van de Poppe posted his predictions about some cryptocurrencies, including Chainlink (LINK), Sui Network (SUI), Arbitrum (ARB), and Cosmos (ATOM).
For LINK, van de Poppe noted that the token could continue its uptrend in the coming months. He also mentioned that the price could hit as high as $25 to $30.
Request 01 – $LINK | @chainlink
This one looks primed for continuation.
The $BTC pair is making higher highs, higher lows & held a higher timeframe support level.
Expecting a breakout to $25-30 in the coming months to occur. pic.twitter.com/JIIJ1QgB2H
— Michaël van de Poppe (@CryptoMichNL) January 21, 2024
LINK’s Potential Remains Bullish
LINK’s price at press time was $15.20. So, if it runs to $30, it means the cryptocurrency’s price could close in on a 2x within a few months.
A look at the 4-hour chart showed that LINK’s volatility jumped in the last few days. However, indications from the Bollinger Bands (BB) showed that the volatility had reduced. In a highly bullish case, LINK has the potential to reach $16.50 in the short term.
But if selling pressure increases, the price could fall back to $14.45. Meanwhile, the Accumulation/Distribution (A/D) indicator was 114.62 million.
LINK/USD 4-Hour Chart (Source: TradingView)
An assessment of the A/D showed that over 2 million LINK tokens have been accumulated since January 1. Should the accumulation continue to outpace distribution, then LINK might breakout and head toward $25.
SUI Sub $1 Could Be a Steal
For SUI, the analyst noted that a correction could lead it below $1. He, however, mentioned that the price could run upwards much later. So, market participants should be looking to buy the dip.
Request 05 – $SUI | @SuiNetwork
This one is also having a general correction, which is fine.
The optimal zone for entries is coming up, before the upwards trend is continuing.
Buy the dips. pic.twitter.com/bmYY0uY7oG
— Michaël van de Poppe (@CryptoMichNL) January 21, 2024
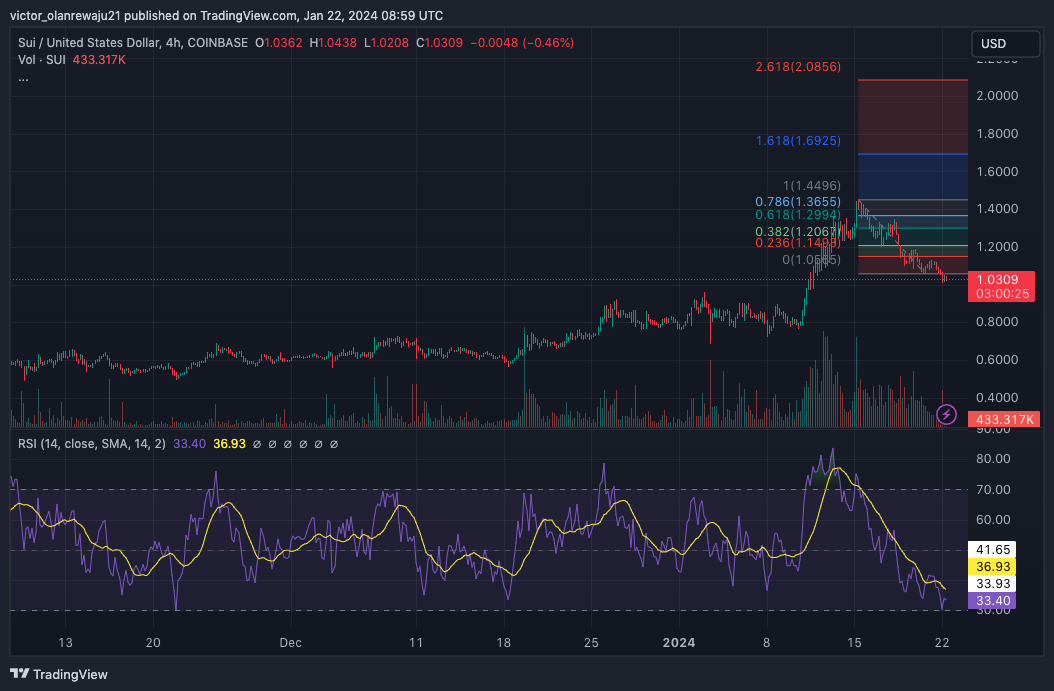
SUI went through an 8.24% correction in the last 24 hours, bringing the price down to $1.02. On January 15, SUI reached a new high of $1.43.
However, the surge led holders of the token to take some profit, leading the RSI to 33.40. The RSI reading suggests high bearish momentum. But if the reading falls below 30.00, SUI would be overbought.
In this instance, the price could reverse upwards. Also, if there is an increase in buy bids, the 1.618 Fibonacci level shows that SUI might hit $1.69.

SUI/USD 4-Hour Chart (Source: TradingView)
ARB to Undergo Deeper Correction
When van de Poppe mentioned ARB, he noted that the token was undergoing a necessary correction. But on a positive note, he added that a run to $3 could be inevitable. So, traders should look forward to having entries around $1.40 to $1.85.
Request 01 – $ARB | @arbitrum
I’ve been mentioning the fact that corrections do take place.
Just like any other project, $ARB is having one.
This region between $1.40-1.85 is an area I’d be looking to get myself positioned before a potential run to $3. pic.twitter.com/FhbnrLoB41
— Michaël van de Poppe (@CryptoMichNL) January 21, 2024
From the 4-hour chart, the 9-day EMA (blue) was at $1.80. The 20-day EMA (yellow), on the other hand, was at $1.83. Since ARB has broken below both EMAs, it means that the price could continue to decrease.
As van de Poppe pointed out, ARB could drop as low as $1.40. In the meantime, market players should watch out for the $1.65 region which seems to be a significant point of interest.
ARB/USD 4-Hour Chart (Source: TradingView)
ATOM to $26?
According to the analyst, ATOM has been lagging. But he also noted if the price maintains its stay below $7.50 and $9.00, it could break out to $22 to $26.
Request 04 – $ATOM | @cosmos
Cosmos has been lagging behind like Polkadot.
Crucial area to hold, if this area between $7.50-9.00 is going to hold, likely a breakout to $22-26 seems next. pic.twitter.com/WK9EgBcHid
— Michaël van de Poppe (@CryptoMichNL) January 21, 2024
Coin Editon considered the ATOM/USD 4-hour chart and observed that there were attempts to rise to $10. However, the resistance at $9.95 ensured that the efforts were rejected.
ATOM had also dropped below the $9.55 support, confirming that the price action was weak. Furthermore, signals from the Aroon indicator showed that the price could still decrease.
This was because the Aroon Down (blue) was 100% while the Aroon Up (orange) was 50%. A situation like this infers that sellers are aggressive compared to buyers.
ATOM/USD 4-Hour Chart (Source: TradingView)
However, there is a chance that sellers might get exhausted. When this happens, bulls might capitalize on the opportunity and probably send ATOM in the $22 direction.
Disclaimer: The information presented in this article is for informational and educational purposes only. The article does not constitute financial advice or advice of any kind. Coin Edition is not responsible for any losses incurred as a result of the utilization of content, products, or services mentioned. Readers are advised to exercise caution before taking any action related to the company.
Read the full article here

