As we march towards 2024, the cryptocurrency market stands at the cusp of a transformative era, with the anticipated approval of Bitcoin and Ethereum spot ETFs. This pivotal development, coupled with the ongoing market recovery, is laying suitable ground for burgeoning investment opportunities. The potential mainstream adoption of these digital currencies by traditional market players is poised to significantly enhance their appeal and utility.
Amid this development, hidden undervalued crypto tokens, each priced under $1, become a lucrative opportunity for traders. These tokens offer not just affordability but also the potential for exceptional growth in one’s portfolio.
Also Read: Here’s Why Robert Kiyosaki Advises Buying Bitcoin Amid A Potential Market Collapse
XRP(Xrp)
XRP(Xrp) | TradingView Chart
Over the past two weeks, the XRP price has been navigating a narrow range within a symmetrical triangle, reflecting its current market dynamics. The pattern’s influence over market participants is evident as the coin price has rebounded from its trendlines twice.
On November 30th, the XRP price rebounded from the triangle’s lower trendline and is now trading near $0.606. This movement suggests a potential bullish reversal, which attempts a bullish breakout from the upper boundary.
If the recent corrections have rejuvenated the bullish sentiment, an upward breakout from the upper trendline could signal a continuation of the recovery trend, potentially increasing the XRP value by 12% to reach the critical $0.7 mark, followed by $1.
Kaspa (KAS)

Kaspa (KAS) | TradingView Chart
In November, Kaspa coin came out as a standout performer in the cryptocurrency market. The recovery initiated at $0.05, it experienced an explosive surge of nearly 210%, reaching a new all-time high of $0.1548.
Following this impressive rally, the coin price movement has entered a phase of consolidation, tracing within two converging trendlines. This pattern is indicative of a bullish continuation known as a pennant.
On December 1st, the KAS price gave a bullish breakout from the upper boundary of this pattern signaling the consolidation recuperates the bullish momentum. If the coin price shows sustainably above the breached trendline, the buyers could prolong the rally another 82%, targeting a new high of $0.25.
Oasis Network(ROSE)
Oasis Token(ROSE) | TradingView Chart
Since mid-October, the Oasis Network (ROSE) token has embarked on a notable recovery journey. Its price rebounded from $0.0396 and soared to a recent high of $0.0892, marking an impressive 124% increase.
The weekly timeframe chart reveals this significant parabolic growth, which has led to the formation of a reversal pattern known as a Double Bottom. This bullish signal indicates an increased accumulation of investors at the market bottom. Currently, the ROSE price stands at $0.08399 and is on the brink of surpassing the crucial neckline resistance at $0.0857.
Overcoming this barrier would be a strong indication of a trend shift, providing investors with a robust foundation for further growth. Should a breakout occur, we could anticipate a substantial 62% surge in the token’s value, potentially reaching a new high of $0.138.
Cronos(CRO)
Cronos(CRO) | TradingView Chart
Amid the current market uncertainties, the Cronos price recently entered a corrective phase, retreating from the $0.12 resistance level. This downturn has resulted in a 25% drop in its price, now trading at around $0.0909.
However, an analysis of the daily chart reveals that this correction forms part of a classic bullish reversal pattern known as ‘Cup and Handle’, suggesting a potential resurgence of bullish momentum.
The coin price witnessing demand pressure at the $0.0835 level, indicating that a rebound might be imminent. If this support holds, the CRO price could see a 36% rise, aiming to breach the pattern’s neckline resistance.
A successful bullish breakout from this formation would signify the coin’s exit from a prolonged 17-month accumulation phase. Following such a breakout, the coin’s value could surge another 62%, with targets set at the psychological barrier of $0.20 and subsequently at $0.227.
Klaytn (KLAY)
Klaytn (KLAY) | TradingView Chart
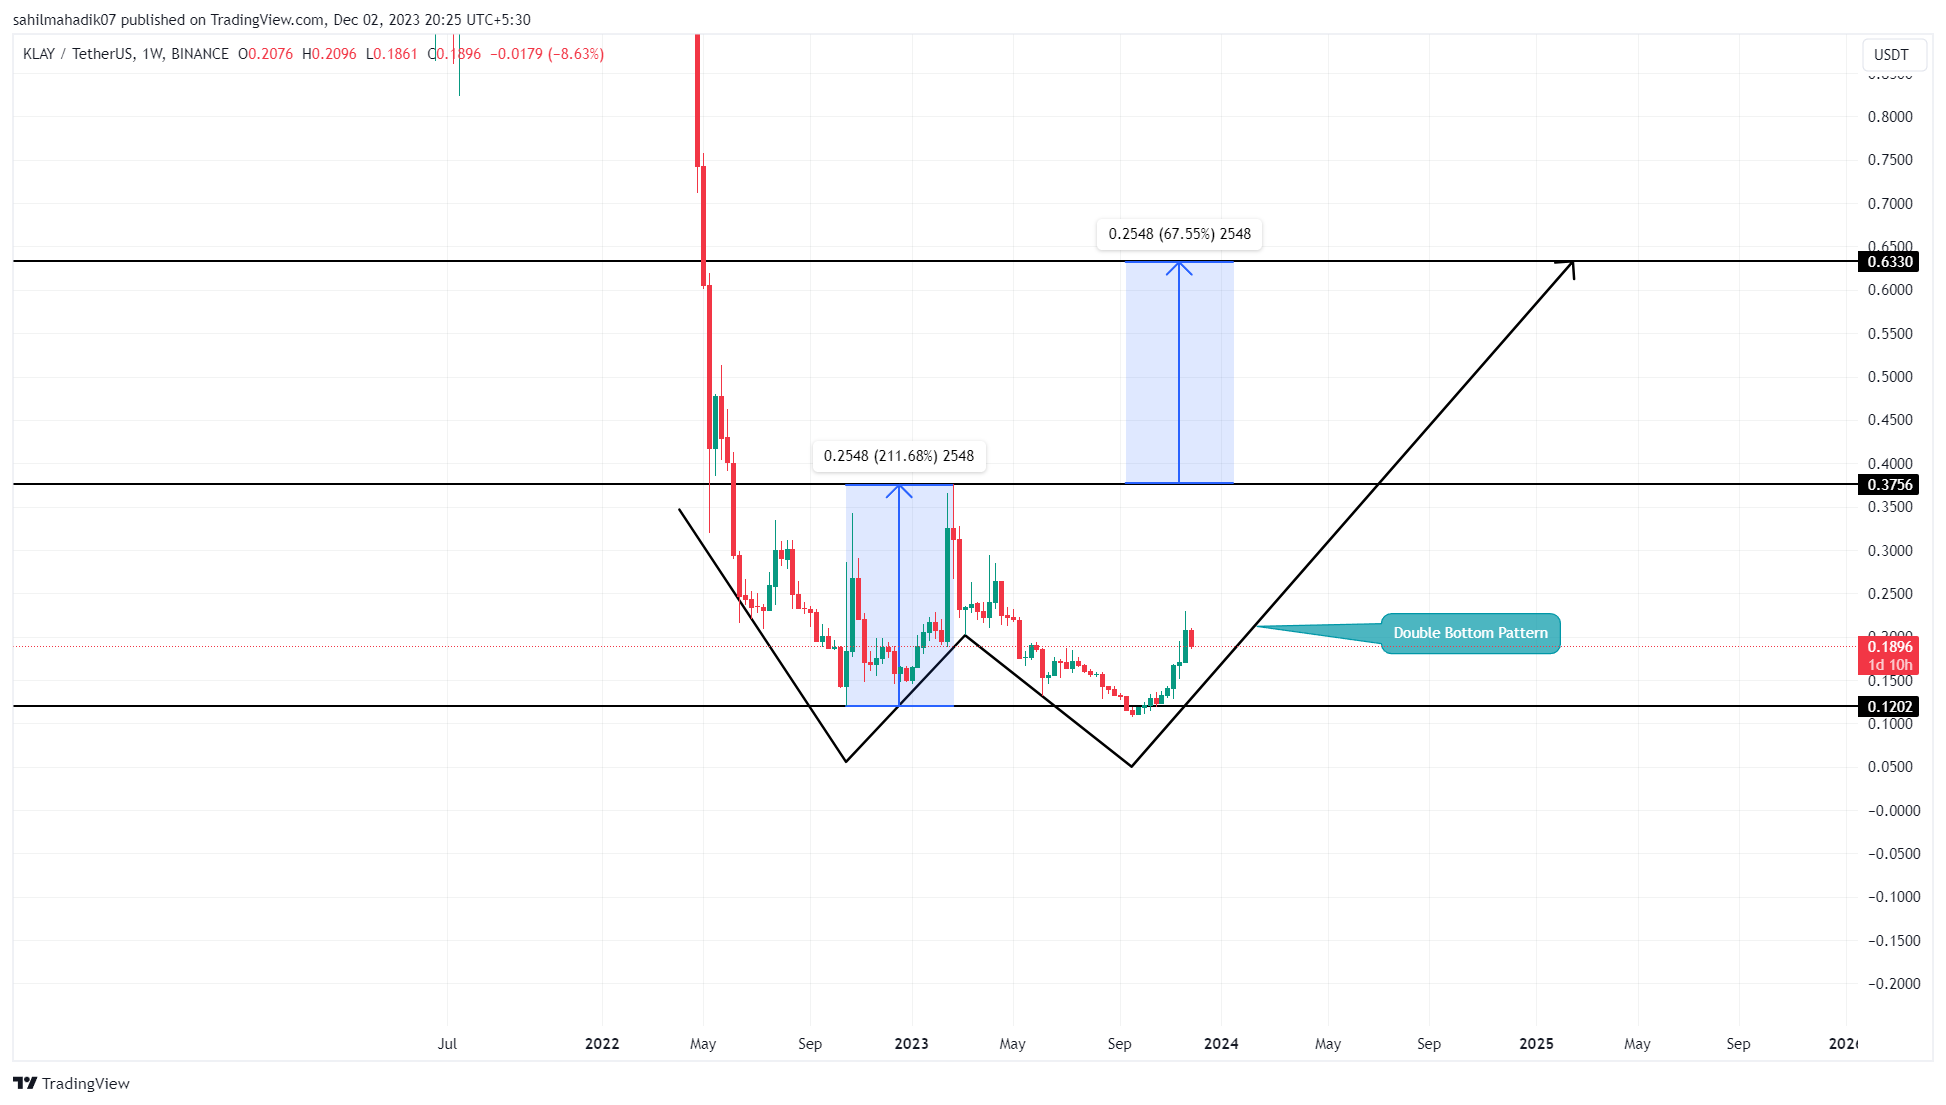
Since mid-September, the Klaytn (KLAY) token has shown a remarkable recovery, bouncing from a low of $0.107 to a recent high of $0.19. The daily time frame chart reveals that this 113% recovery has contributed to the formation of a rounding bottom pattern, a classic indicator of an impending trend reversal.
Bolstered by this technical formation and an overall improvement in market sentiment, the KLAY price is poised for further growth. With sustained buying, the coin could rise another 98%, aiming to test the neckline resistance at $0.38.
A bullish breakout from this critical juncture would give better confirmation of the upcoming bull run which could surge the KLAY price to a 20-month high of $0.63.
Read the full article here

