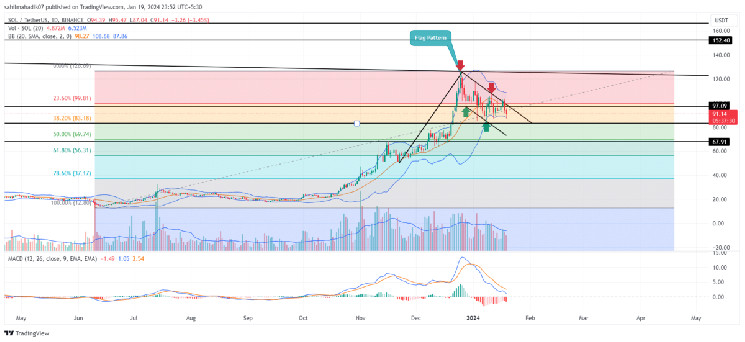
Solana Price Prediction: For nearly a month, the 4th largest cryptocurrency Solana(SOL) has been under a correction trend partially attributed to the uncertainty surrounding the newly launched Bitcoin ETF. In our previous analysis, we market this downfall as the formation of a Flag pattern, commonly observed in an established uptrend. However, the buyers’ attempt to break out of this pattern failed to sustain amid the market sell-off, positioning the SOL price at risk of further downfall.
Fake Breakout Triggers a $19 Million Long Liquidation
- A failed breakout from the flag pattern hints at prolonged correction in SOL
- The Bollinger band curved on the downside indicates the sellers are aggressive
- The 24-hour trading volume on the Solana coin is $2.7 Billion, indicating a 4.3% gain.
Solana Price Prediction| TradingView Chart
On January 17th, the Solana price recovery teased a bullish breakout from the resistance trendline of the Flag pattern. This breakout coincided with Solana Network active addresses hitting a high of 429,162 reflecting a sustainable growth opportunity for coin holders.
However, the Solana price reentered the Flag on Thursday with a 7.5% intraday loss as the crypto market witnessed a sudden sell-off. With a 6.4% drop today, altcoin showcased a suitable follow-up to the reversal and confirmation of the failed breakout
In the last two days, the Solana traders have witnessed nearly $19 Million in long-liquidation as per the derivative data analysis platform Coinglass. This forced exit of long traders intensifies selling pressure on this asset, indicating the continuation of the correction trend.
With sustained selling, the SOL price may tumble 20% before hitting the crucial support zone created by combining the horizontal level of $68 and the 50% Fibonacci retracement level.
Solana Price Sees Bullish Turnaround from 50% FIB Level
The short-term outlook for the Solana price appears bearish, yet a retracement to the 50% Fibonacci level is viewed as a healthy correction within an overarching uptrend. Such a pullback may provide an opportunity for buyers to regroup and regain momentum, potentially reigniting the previous recovery trajectory. If buyers successfully breach the flag pattern, it could significantly boost buying interest, setting the stage for a push toward a potential target of $166
- Bollinger Band: The narrow range of the Bollinger Band indicator projects heightened market volatility
- Moving Average Convergence Divergence: A bearish crossover state between MACD and the signal line below the neckline would indicate the sellers are in control.
Related Articles:
- Solana Price Prediction: $100 Hurdle Impedes Breakout, Pullback To $90 Imminent?
- Here’s Why Solana Price May Surge 28% Before Month End
- Crypto Price Prediction For January 19: SOL, MANA, TIA
Read the full article here

