


According to Captain Faibik, a technical analyst, participants holding altcoins should be patient. In his post, Faibik noted that the altcoin market could soon reach bullish levels.
In two other posts, the analyst mentioned two of the altcoins with immense bullish potential. First, it was Solana (SOL), and the second one was Chainlink (LINK).
SOL to $333?
According to Faibik, SOL could be on its way to $333. He defended his point by sharing a 3-day chart showing SOL breaking out of a descending movement. Lately, the cryptocurrency has experienced a significant correction.
$SOL #Solana is Road to the $333 📈 pic.twitter.com/6FXD3FSKyQ
— Captain Faibik (@CryptoFaibik) January 30, 2024
But the last 24 hours have been positive for the price action. As of this writing, SOL’s price was $103.25, representing a 6.81% 24-hour climb.
The SOL/USD 4-hour chart confirmed that the market structure had left its bearish condition and was heading in a bullish direction. The chart also showed that SOL was able to clear the $99.23 resistance, which seemed like a difficult hurdle to cross.
If SOL continues with this same momentum, it might breach $108.53, which is the next major resistance.
Technical indication using the Accumulation/Distribution (A/D) line showed that bulls have resisted bears from taking control of the momentum. However, if SOL plans to hit $333, demand has to be much higher than it is.
SOL/USD 4-Hour Chart (Source: TradingView)
In the short term, SOL could rise to $150, considering the state of the RSI. At press time, the RSI showed that buying pressure was extremely high.
While the price might retrace, the support at $100 might help SOL sustain the movement. Faibik, in his other tweet, mentioned that LINK could also be getting ready to rally.
LINK Eyes $16.50
$LINK #Chainlink is gearing up for the next big move.📈 pic.twitter.com/3FY8MZpVHd
— Captain Faibik (@CryptoFaibik) January 30, 2024
LINK also had a similar structure to SOL, as the price jumped above $15. The Moving Average Convergence Divergence (MACD) had moved into the positive region. Also, the 12 EMA (blue) and 26 EMA (orange) were above the zero histogram point.
This position implies that buyers outpaced sellers. If this remains the case, then LINK could be prepared for a move that takes it to $16.50.

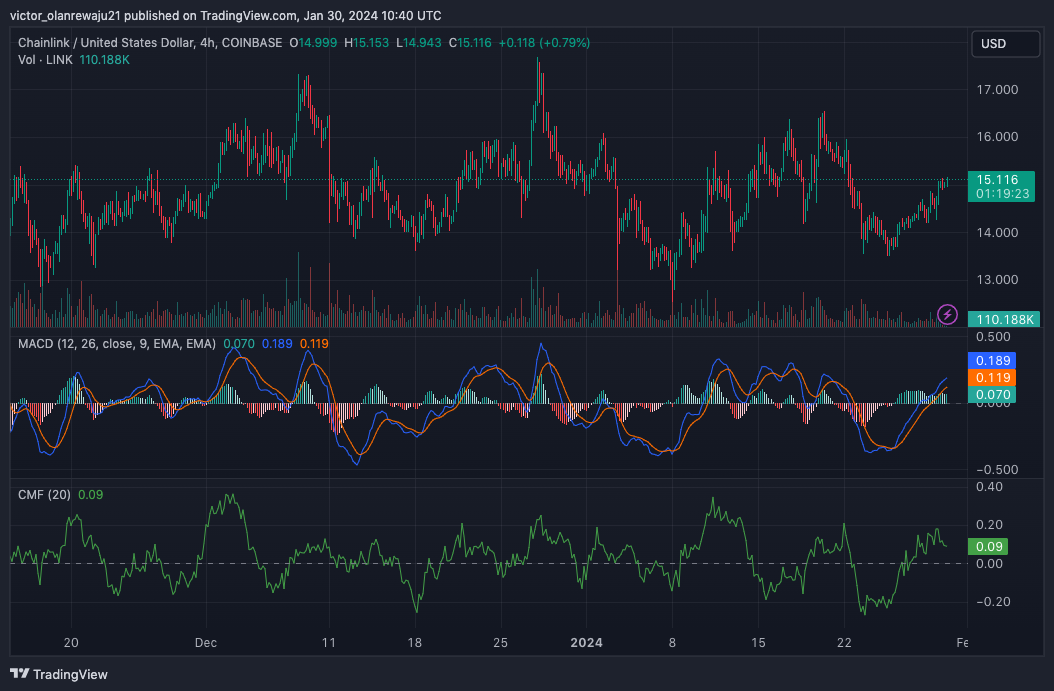
LINK/USD 4-Hour Chart (Source: TradingView)
Like the MACD, the Chaikin Money Flow (CMF) also rose to a positive reading. This movement confirms the sentiment that LINK could be set for a big move soon.
Disclaimer: The information presented in this article is for informational and educational purposes only. The article does not constitute financial advice or advice of any kind. Coin Edition is not responsible for any losses incurred as a result of the utilization of content, products, or services mentioned. Readers are advised to exercise caution before taking any action related to the company.
Read the full article here


 Signal, Bitcoin (BTC) Crucial $60,000 Resistance Reached")
 Cryptos Outshining This Week")


