


Technical analysis is an essential tool for investors in the cryptocurrency market, especially those trading in the futures market. So, what does technical analysis tell us about Ripple, which is currently trading at $0.6178? Let’s delve into a detailed chart analysis, examining important support and resistance levels.
Daily Chart Analysis for Ripple
The most crucial formation to watch on the daily chart for Ripple is the ascending channel formation. During the rally on November 14, XRP encountered a significant resistance line and faced a significant correction. In the process, XRP has been consolidating in a narrow range in recent bar closings, waiting for a breakout in either direction to determine the trend.
The most important support levels to watch for Ripple on the daily chart are $0.6039, $0.5863, and $0.5594, respectively. If the daily bar closes below the intersection of EMA 200 (red line) and the $0.5594 level, it could lead to significant selling pressure for XRP.
The most important resistance levels for Ripple on the daily chart are $0.6290, $0.6500, and $0.6717, respectively. If the daily bar closes above the significant barrier at $0.6290, it could propel XRP to gain momentum.
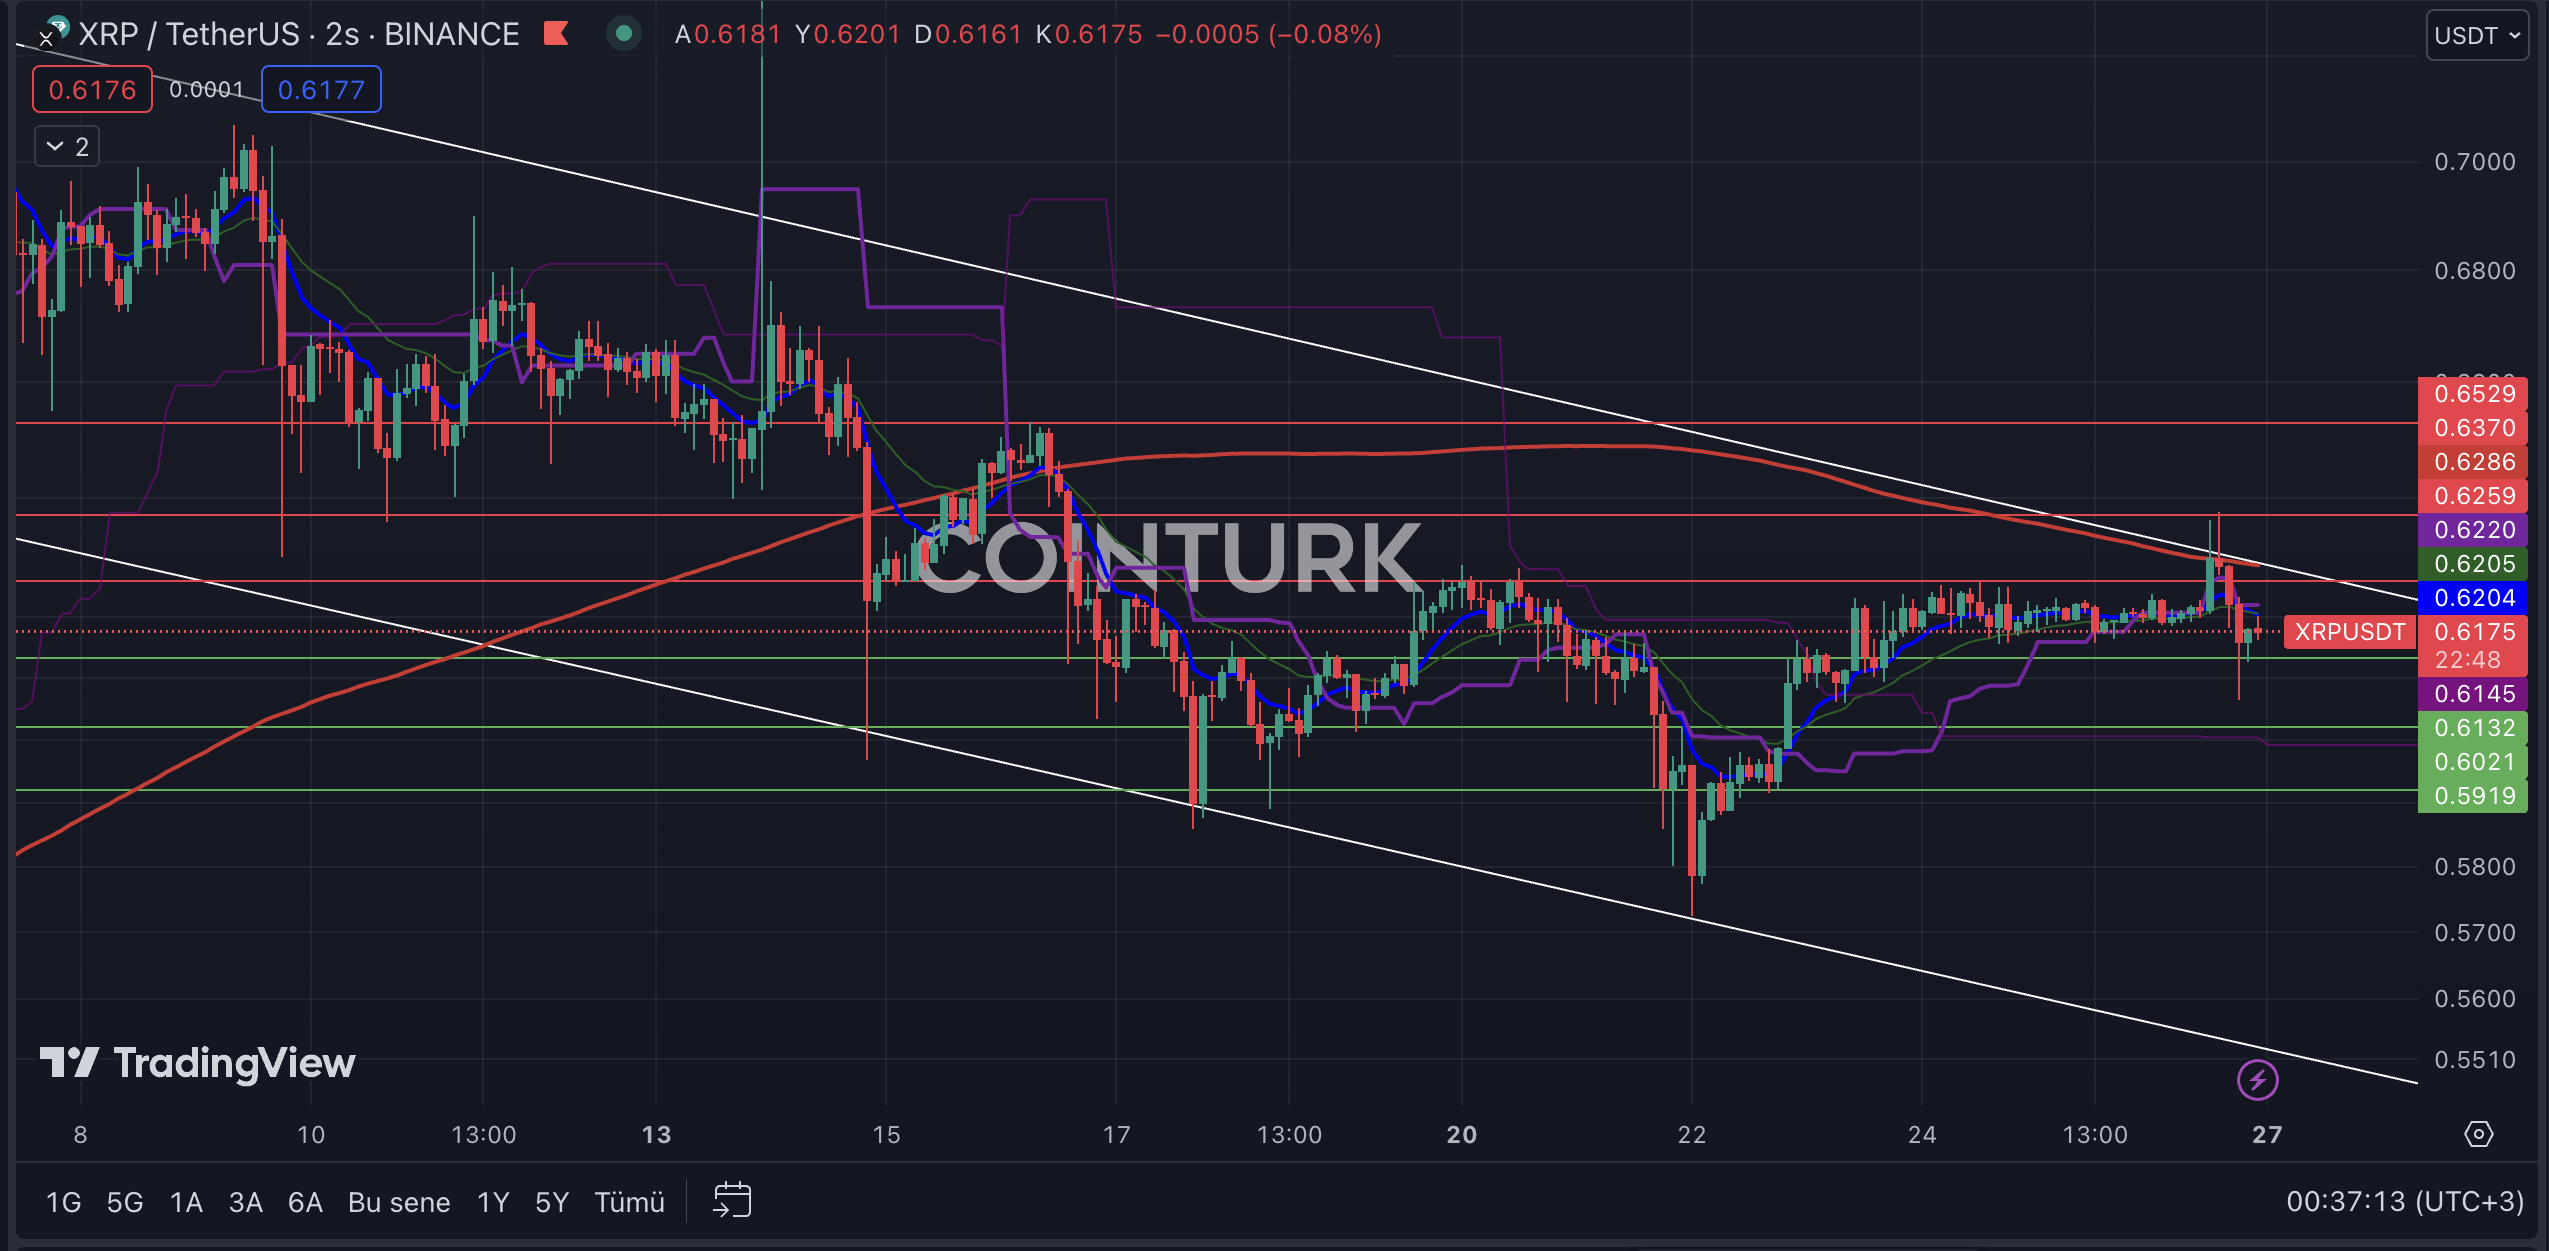
Two-Hour Chart Analysis for Ripple
The descending channel formation stands out in the two-hour chart analysis for Ripple. Despite a significant breakout during the rally on November 14, the formation remained as a mere spike, highlighting its importance. After attempting a breakout, XRP faced selling pressure following a failed breakout attempt.
The most important support levels to watch for XRP on the two-hour chart are $0.6132, $0.6021, and $0.5919, respectively. If the bar closes below the key support line at $0.6132, it could lead to selling pressure for XRP.
The most important resistance levels to watch for XRP on the two-hour chart are $0.6259, $0.6370, and $0.6529, respectively. If XRP breaks above the significant barrier at $0.6370, it could accelerate its upward momentum.

Read the full article here


 Signal, Bitcoin (BTC) Crucial $60,000 Resistance Reached")
 Cryptos Outshining This Week")


