


Cryptos have recorded modest gains this week with Bitcoin (BTC) and Solana (SOL) making sizeable strides among other majors like Ethereum (XRP) and XRP. Although relatively new, SUI price emerged as another notable gainer, up 5.5% to $1.6.
The increase in trading volume to $480 million and the market cap holding at $1.8 billion underscore the growing interest in the token among traders. On top of the daily gain, SUI’s value has increased by a staggering 26% in the last seven days, 27% in a fortnight, and 100% in a month.
Recommended: 3 Reasons Why Terra Classic (LUNC) Price Could Explode To $1 In 2024
Can SUI Price Outperform Bitcoin In 2024?
SUI price is testing resistance at $1.6 as shown by the yellow band on the daily chart below. On account of the rebound from support around $1 backed by the 20-day Exponential Moving Average (in blue), traders significantly increased exposure to long positions in the token.
This bullish outlook in a period marked by negative and uncertain market forces made SUI even more attractive to investors who believe it can continue with the price discovery.
SUI price chart | Tradingview
Insight from the Relative Strength Index (RSI) backs the bullish theory as the indicator climbs toward the overbought area.
Traders would be looking out for a break above resistance at $1.6 in the next sessions. A successful retest of this huddle could ignite another buying spree and in turn, blast SUI price to $2. Recent bullish moving average crossovers indicate a higher probability of keeping the uptrend intact.
If the above seller congestion refuses to budge, the token might settle and consolidate above the first crucial support at $1.4. In case the same level weakens and SUI pierces through, losses might return to $1 with the potential for rebounds at the 20-day EMA and the 200-day EMA.
On the other hand, Bitcoin price upholds support at $43,000 as it wobbles towards resistance at $44,000. The support highlighted at the 20-day EMA continues to back the positive technical outlook.
However, until BTC steadies above the $44,000 hurdle, a bearish could continue to hover and perhaps send the price back to $40,000.

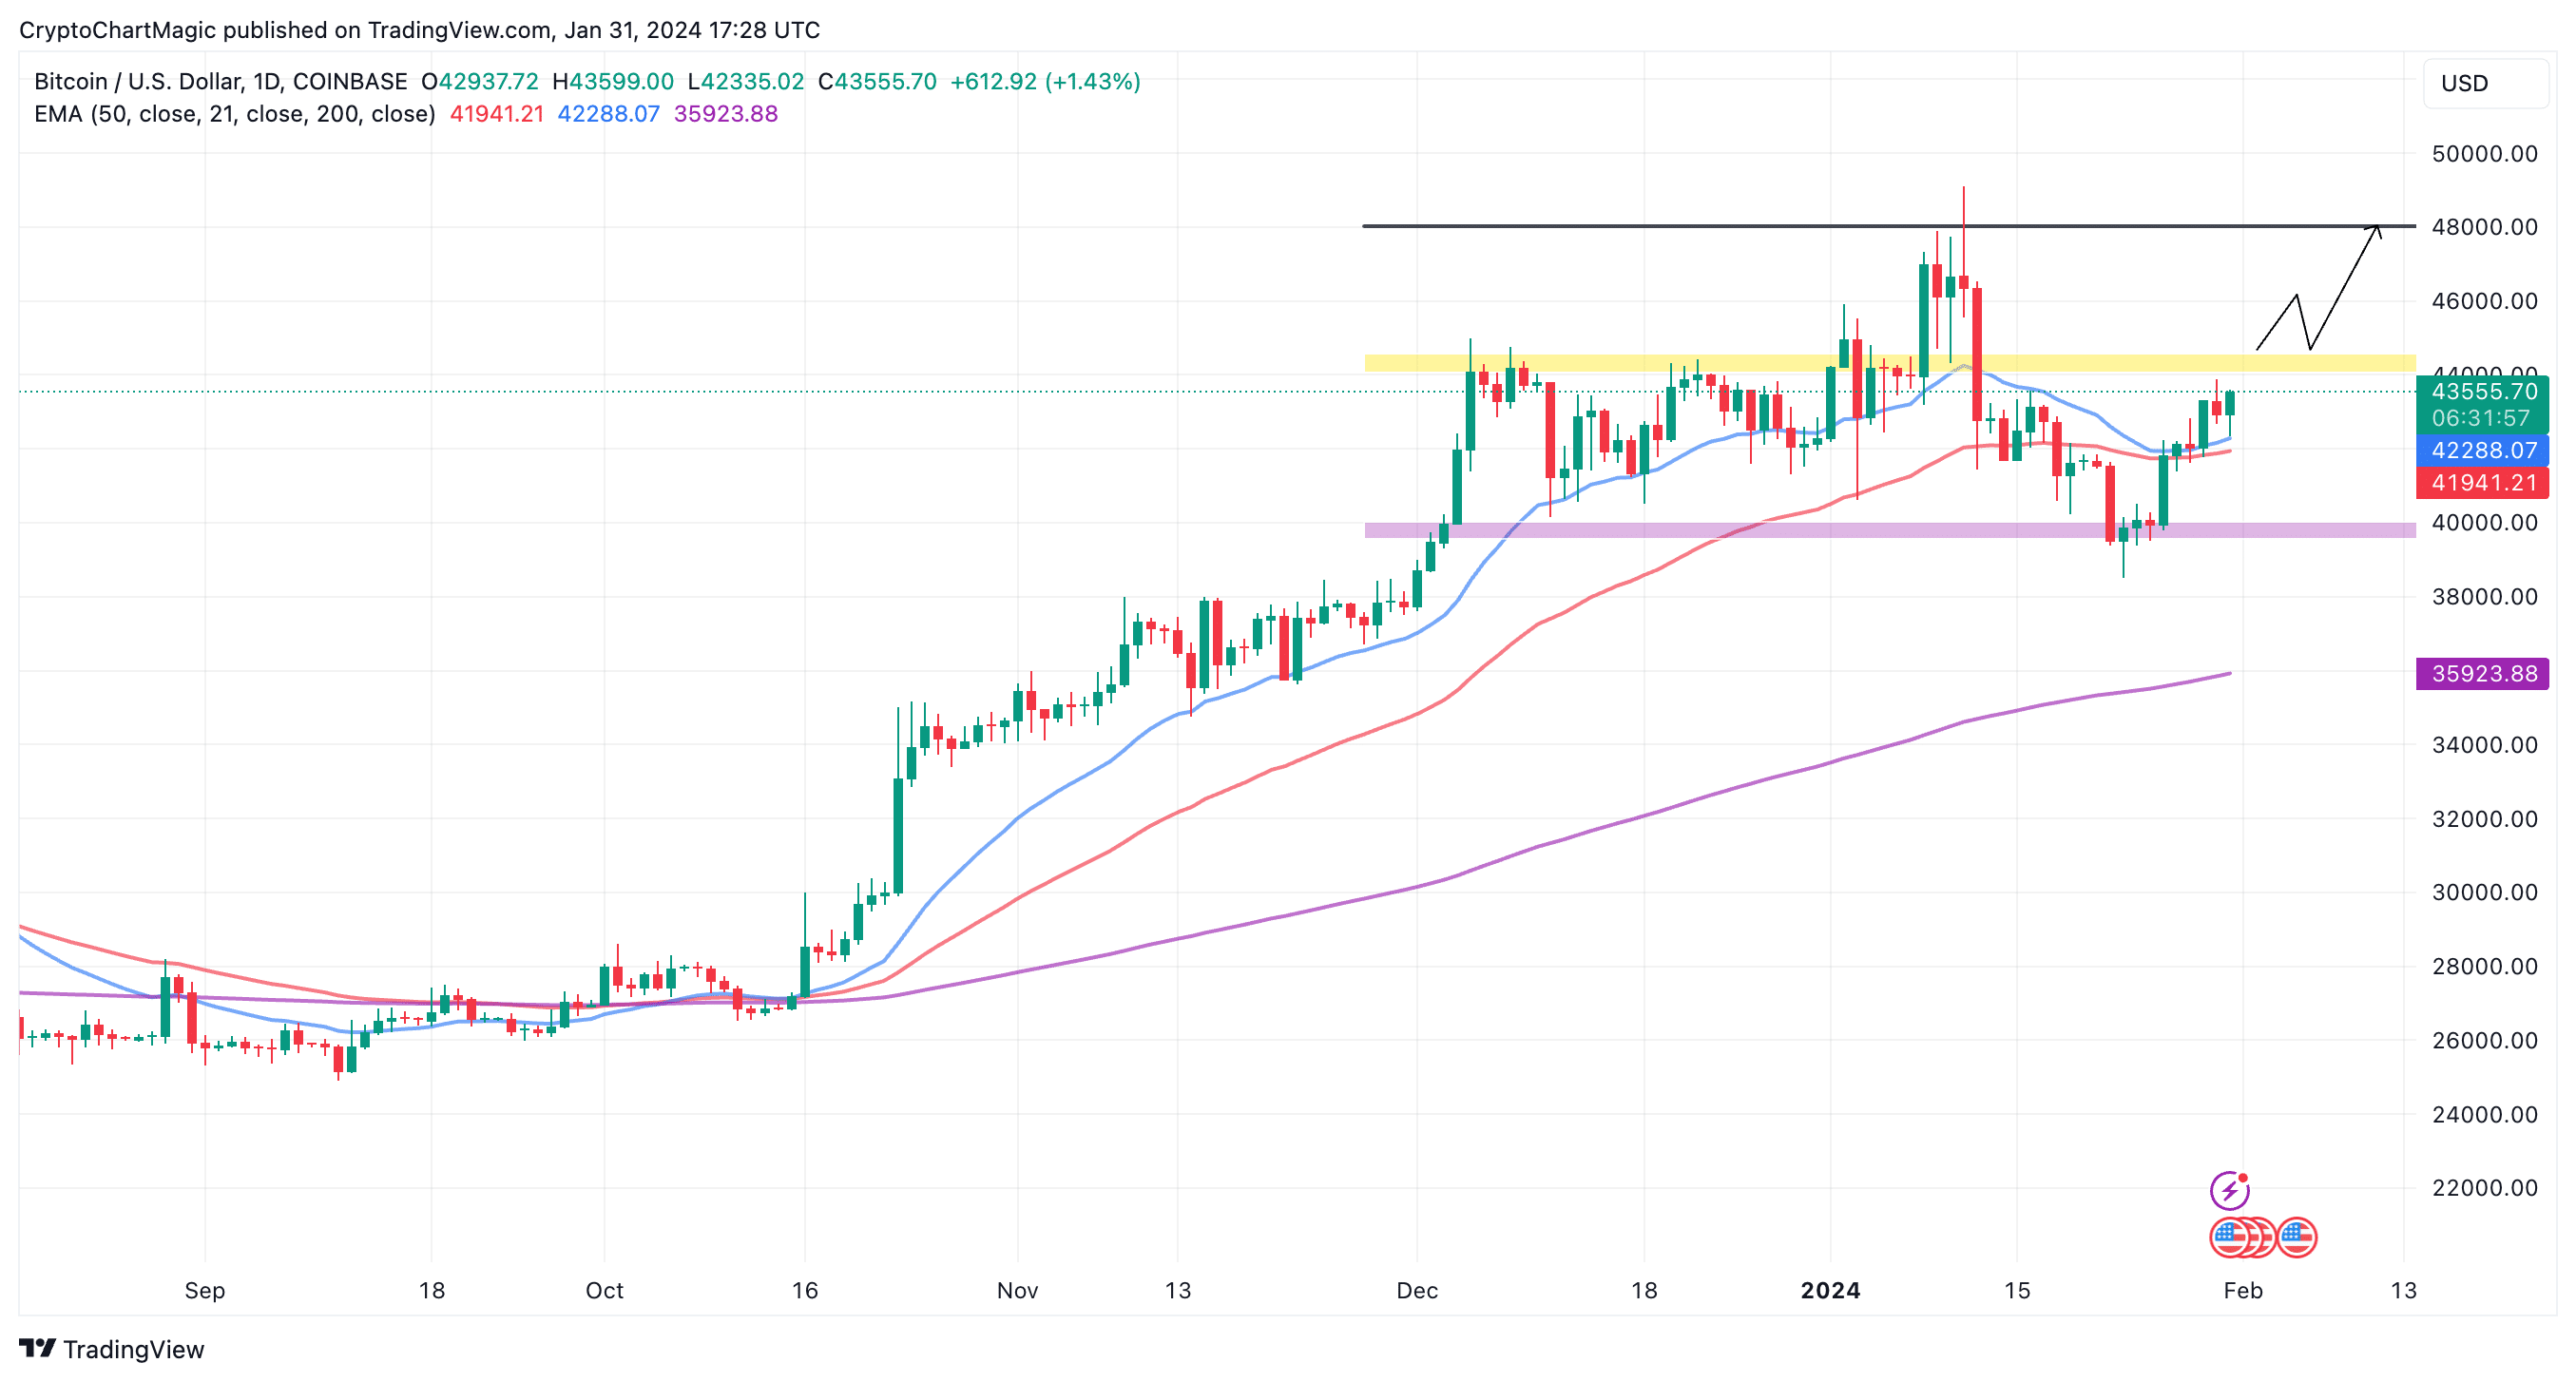
BTC price chart | Tradingview
If denied a breakout beyond $48,000, traders may start acclimatizing to Bitcoin price trading sideways with support at $40,000 holding firmly for the foreseeable future.
Meanwhile, dips have proven to be highly profitable. The reason why investors may want to employ a dollar-cost average (DCA) strategy ahead of the pre-halving and post-halving rallies this year.
Related Articles
- Ethereum Price Prediction: Is $ETH Recovery Heading to $3000 in February?
- XRP Price Eyes Lift Off TO $2.2 In Feb As Bulls Navigate Market Volatility
- Shiba Inu Price Prediction: Is SHIB Ready To Reclaim $0.00001 Value In Feb
Read the full article here


 Signal, Bitcoin (BTC) Crucial $60,000 Resistance Reached")
 Cryptos Outshining This Week")


