


Shiba Inu Price Analysis: In line with the current market recovery, the popular memecoin Shiba Inu picked up momentum in February’s second week. A positive turnaround from $0.0000088 propelled the SHIB price 14% up to hit a monthly high of $0.00001. While the current market outlook hints at a prolonged rally, the overhead supply from the long-coming wedge pattern reflects the broader trend remains bearish.
Also Read: What’s Next For Shiba Inu Coin (SHIB) After Hitting $0.00001?
Will SHIB Price Regain $0.00001?
Shiba Inu Price Analysis| Tradingview
After a strong two-week rally, the Bitcoin price is showing signs of slowing momentum at the $52,000 resistance level. This increase in selling pressure has affected the broader altcoin market, including Shiba Inu, which has seen a significant decrease in its price on the daily chart.
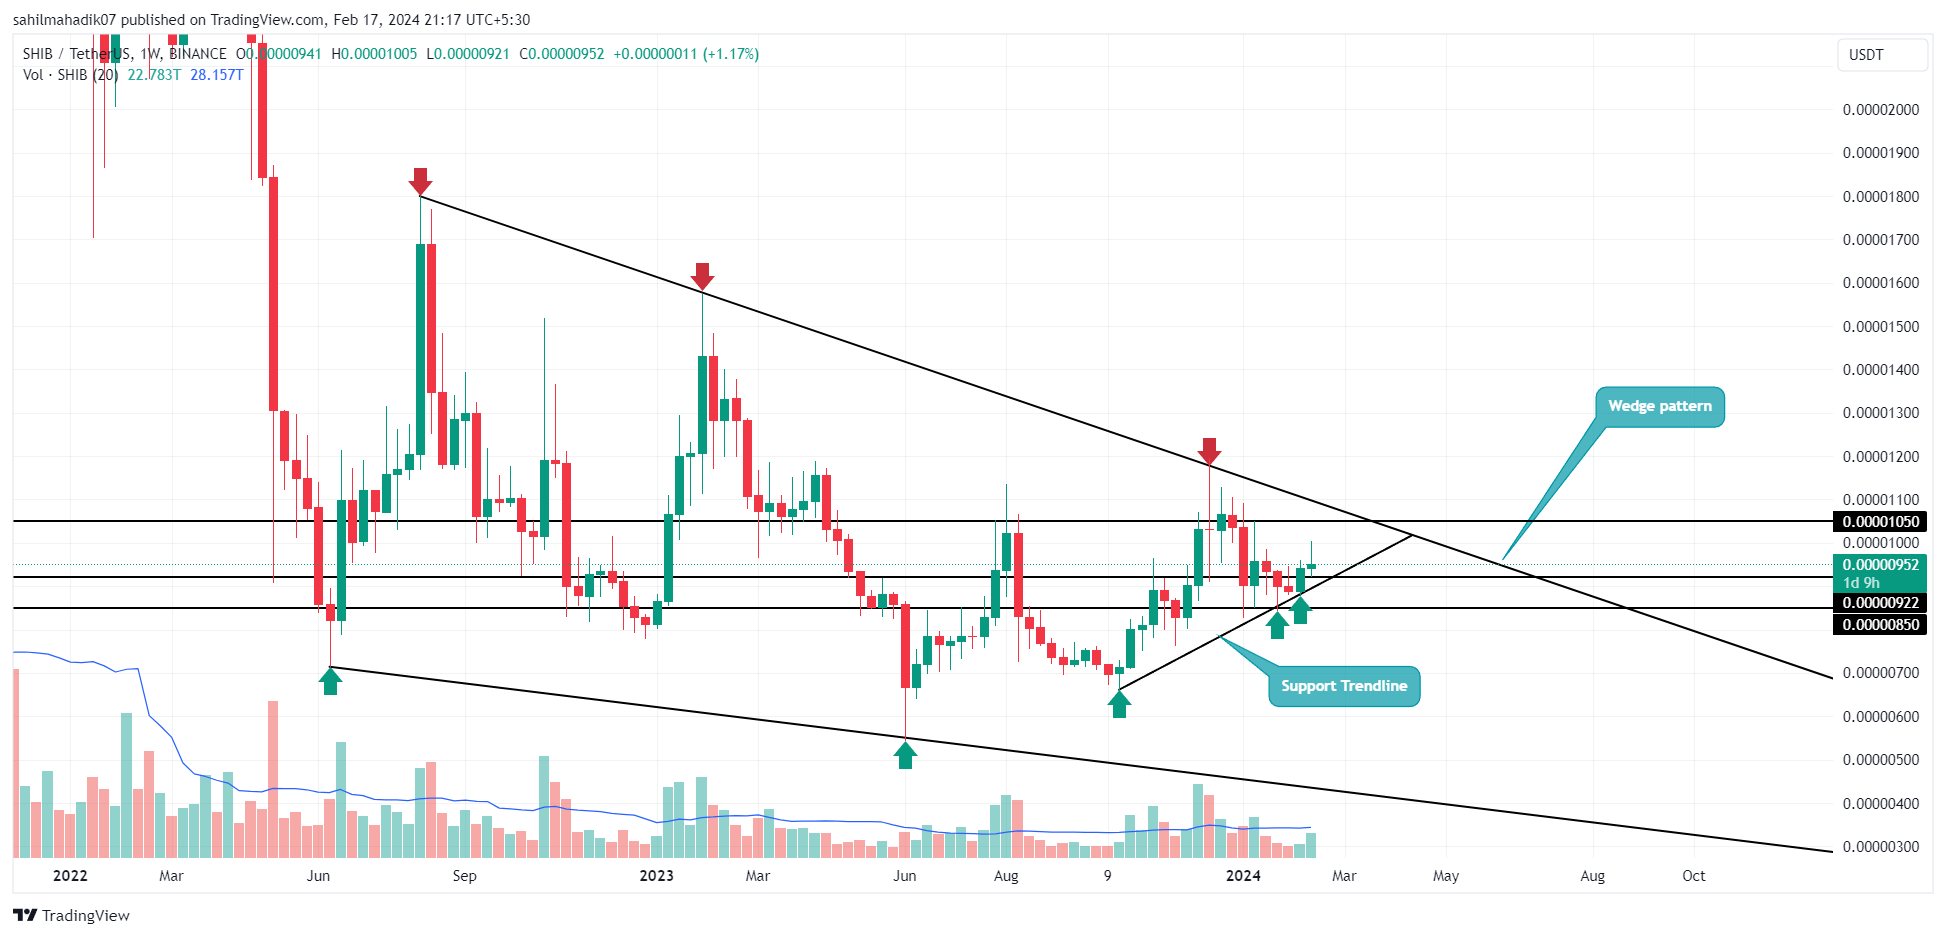
Shiba Inu price experienced a 4% drop today, bringing its trading price down to $0.00000947. Should selling pressure continue to grow, SHIB investors should keep an eye on the crucial support trendline that has historically provided dynamic support, helping the coin’s price to sustain its recovery trend.
Additionally, the current lack of trading volume suggests a weaker case for an immediate price reversal, pointing instead to a potential minor retracement before bullish momentum resumes. The ascending support trendline is expected to play a key role in helping buyers regain control and initiate a lasting price recovery.
This anticipated recovery could potentially increase the SHIB price by 11.5%, aiming for a target of $0.0000105.
Also Read: Shiba Inu Community Unveils Key Upgrade To Boost Shibarium Transactions & SHIB Burn
Wedge Pattern Governs SHIB Price Downtrend

Shiba Inu Price Analysis| Tradingview
An analysis of the weekly time frame chart shows the SHIB price is developing a falling wedge pattern characterized by two converging trendlines. The anticipated rally to $0.0000105 will push the memecoin to retest the pattern’s upper boundary. This resistance has been recorded to accelerate supply pressure and could trigger a new correction trend in the Shiba Inu coin.
Technical Indicator:
- Bollinger Band: An upswing in the upper boundary of the Bollinger band indicator reflects current momentum is bullish.
- Relative Strength Index: The daily RSI slope dropped to 50% market reflecting the neutral sentiment among market participants.
Related Articles: Ethereum, Blur, and Shiba Inu Tokens Top the Smart Money Token Inflow List
Read the full article here


 Signal, Bitcoin (BTC) Crucial $60,000 Resistance Reached")
 Cryptos Outshining This Week")


