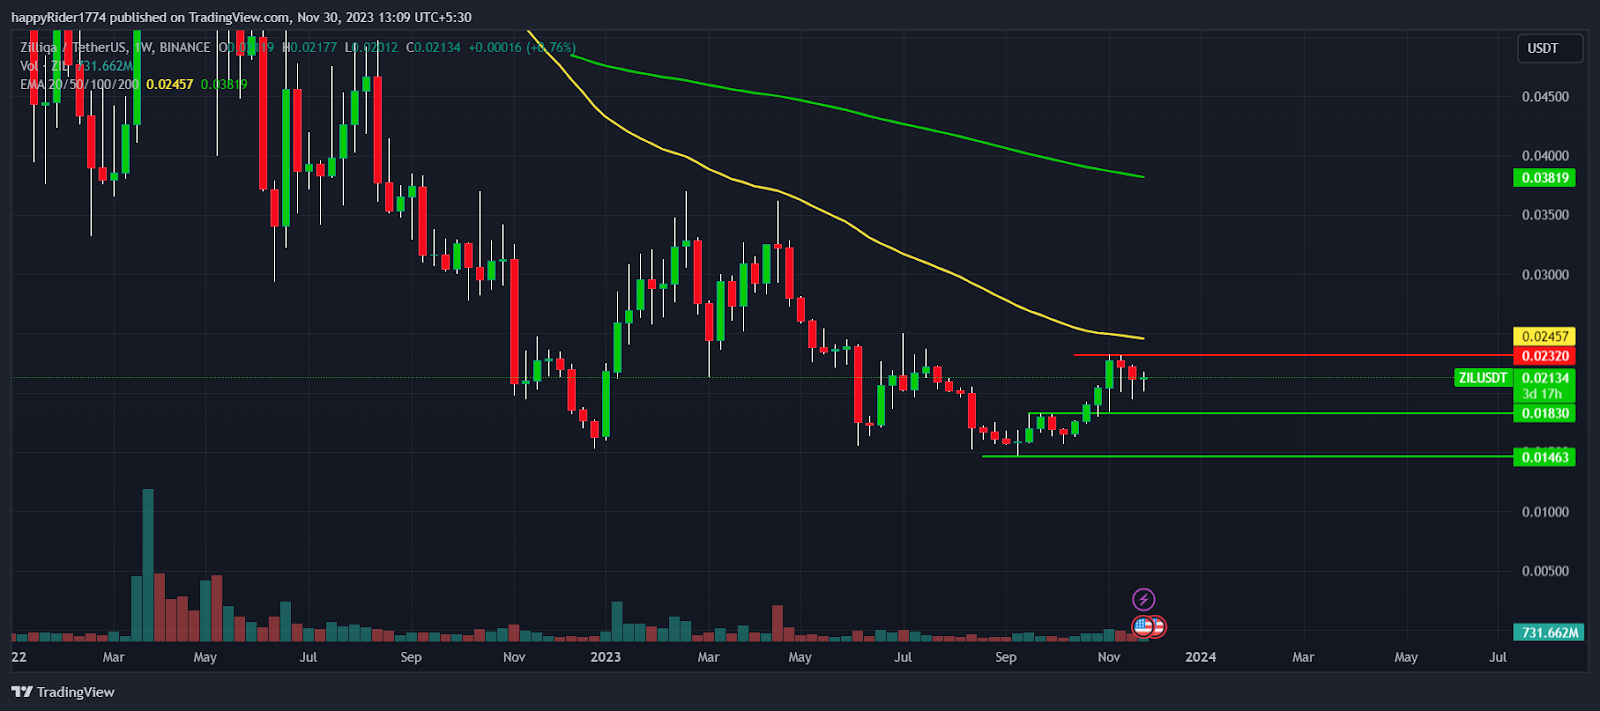
- 1 Zilliqa price is in the recovery phase and rose by 13% in November 2023.
- 2 ZIL price sustains above the 50-day and 200-day EMA.
- 3 The EMAs in the ZIL crypto might display a golden crossover.
Zilliqa price rose by approx. 10% in November and showed a decent recovery from the yearly low. It formed a bullish pattern and incited hope for long-term investors.
Recently, while recovering, ZIL price managed to climb above the 50-day and 200-day EMA. It triggered the positive sentiment and added fuel to the upward momentum.
Meanwhile, gradually, the buying volume increased and the price also followed the same direction. It shows that the rally is supported by genuine buyers so the price is likely to hold the higher levels.
However, in the last week, ZIL crypto price faced rejection from the $0.02320 level and witnessed a minor sell-off. The price lost the bullish momentum and retraced back to the 50-day EMA.
Luckily, the buyers were active and succeeded in halting the downfall and showed a bounce. At present, Zilliqa price is racing toward the recent swing high and preparing for another attempt at a breakout.
At the time of writing, the ZIL/USDT is trading at $0.02151 with a one-day decrease of -0.28%. In the last 24 hours, the trading volume increased by 107% and the volume to market cap stands at 8.01%.
Is ZIL Price Getting Ready to Break the 6-Month High?
Source: ZIL/USDT daily chart by Tradingview
ZIL price is in an uptrend and buyers look more aggressive as compared to the sellers. The chart structure shows that bulls have full control at the $0.01800 level so any short-term correction will be bought up.
On the higher side, $0.23020 is acting as an immediate barrier for the bulls. This crypto needs fresh buying or whale participation to break out of the 6-month high.
Moreover, till Zilliqa crypto price sustains above the $0.01830 level, the probability of the breakout will remain high. The analysis suggests that the ZIL price is inside the buyers’ radar so it’s better to play bullish bets and stay with the trend.
Zilliqa Price Turning Bullish on a Weekly Chart

Source: ZIL/USDT weekly chart by Tradingview
Zilliqa price formed a bullish hammer candle on the weekly chart. It shows that bears have tried to pull the price down and erode the gains. However, due to the strong presence of buyers, they failed.
Presently, ZIL price looks mildly bullish on the weekly chart, and seems that the breakout will be visible soon.
Track all markets on TradingView
The supertrend says that till the price holds $0.01815, the short-term trend will remain bullish and momentum will continue. however, the MACD and RSI suggest that the price may spend more time in consolidation before rising upward.
Conclusion
Zilliqa price rose 10% approx. in November and recovered the losses of the last six months.
ZIL price chart is forming a bullish pattern and suggests that it might show a massive breakout in December. Therefore, it’s better to play bullish bets and stay with the uptrend.
Technical Levels
- Resistance levels: $0.02320 and $0.02600
- Support levels: $0.01830 and $0.01600
Disclaimer
The views and opinions stated by the author, or any people named in this article, are for informational purposes only. They do not establish financial, investment, or other advice. Investing in or trading crypto assets comes with a risk of financial loss.
Amanda Shinoy
Amanda Shinoy is one of the few women in the space invested knee-deep in crypto. An advocate for increasing the presence of women in crypto, she is known for her accurate technical analysis and price prediction of cryptocurrencies. Readers are often waiting for her opinion about the next rally. She is a finance expert with an MBA in finance. Quitting a corporate job at a leading financial institution, she now engages herself full-time into financial education for the general public.
Read the full article here

