


Ripple (XRP) price fell to the $0.55 support as bulls failed to push the price higher. According to CoinMarketCap, the decrease meant that XRP has lost 10.54% of its value on a Year-To-Date (YTD) basis.
From the 4-hour XRP/USD chart, a short-term bullish move to $0.60 might be invalidated. One of the reasons for this prediction could be linked to the resistance at $0.58.
XRP/USD 4-Hour Analysis
Bulls had attempted to push the price of XRP higher. But bears gained momentum, highlighting how bullish had lost control of the market. Under a strong bullish influence, XRP might return to $0.58. But this would require an increase in buying pressure which the token currently lacked.
But a highly bearish situation might send XRP downwards. If this is the case, the price might pull back to $0.52. Ability to defend the $0.52 support might trigger a rebound. However, if bulls lose hold on $0.50, the next level XRP might hit could be around $0.48.
Signals from the Moving Average Convergence Divergence (MACD) indicated an increasing bearish momentum. First, the longer EMA (orange) had flipped the shorter EMA (blue). Furthermore, the MACD reading was negative at -0.0023.
Should buying pressure fail to appear, then XRP’s price might have no other option than to slide more than it has done lately. Besides the MACD, the Aroon indicator also supported a bullish thesis. At press time, the Aroon Up (orange) was 7.14% while the Aroon Down (blue) was 71.43%.
XRP/USD 4-Hour Chart (Source: TradingView)
This disparity implies that bears’ presence in the market was much more than bulls. If this is the case for most of the new week, XRP might not cross the $0.58 overhead resistance. However, consolidation looks likely for the token as it could trade between $0.53 and $0.56 in the short term.
XRP/USD Daily Analysis
On the daily timeframe, the Relative Strength Index (RSI) was 58.01. This reading was a decrease from what the reading was on February 15. As of then, the RSI was 63.53 as XRP’s price increased to $0.57.
Therefore, the decreasing momentum was proof that a further uptrend looked unlikely in the short term. Coin Edition considered the Supertrend indicators. At press time, the red region of the Supertrend was above XRP’s price, indicating a sell signal.

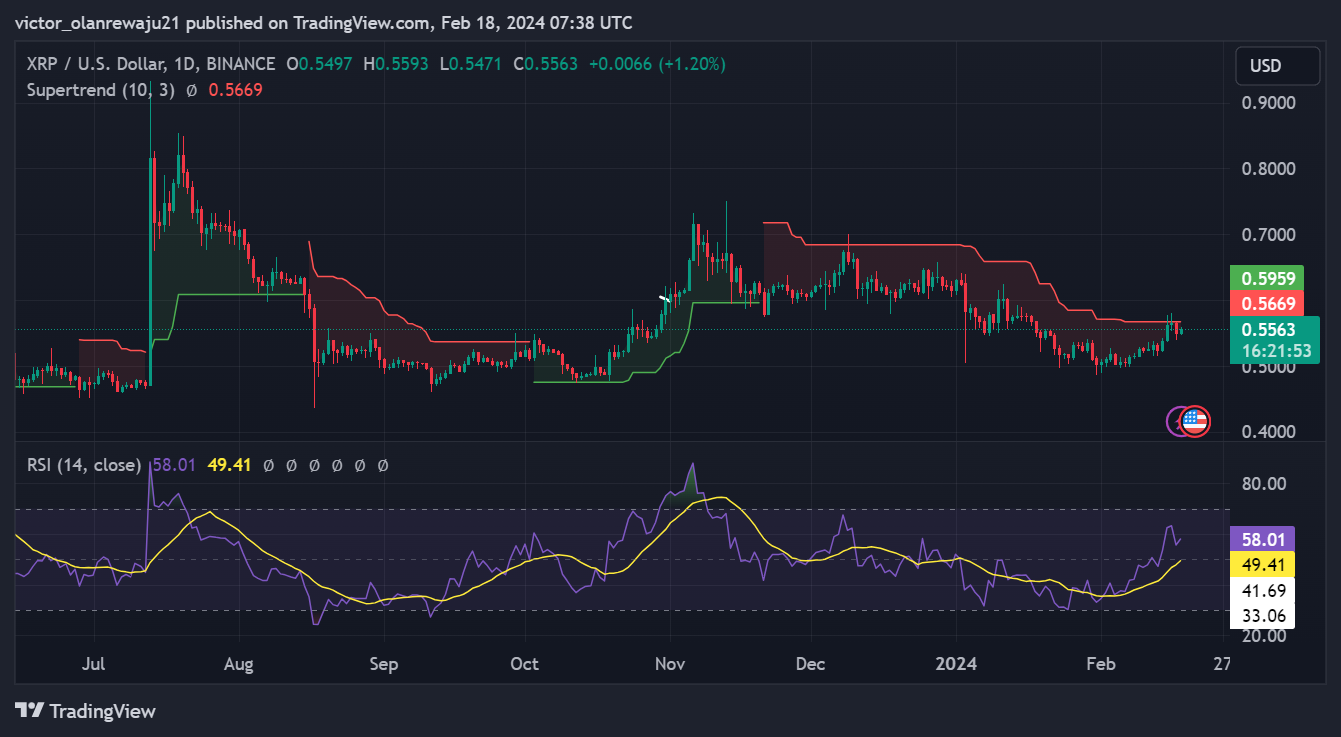
XRP/USD Daily Chart (Source: TradingView)
As it stands, it might be difficult for XRP to regain bullish momentum this new week. But a change in the broader market sentiment could help XRP rebound For now, a decline below $0.55 seems like the likely option for the token.
Disclaimer: The information presented in this article is for informational and educational purposes only. The article does not constitute financial advice or advice of any kind. Coin Edition is not responsible for any losses incurred as a result of the utilization of content, products, or services mentioned. Readers are advised to exercise caution before taking any action related to the company.
Read the full article here


 Signal, Bitcoin (BTC) Crucial $60,000 Resistance Reached")
 Cryptos Outshining This Week")


