


 News: Here’s the Latest Update")


Solana (SOL) has emerged as a standout performer in the cryptocurrency market, with its price surging over 11% in the past week. This impressive rally has outpaced the gains of larger cryptocurrencies such as Bitcoin (BTC) and Ethereum (ETH), pushing SOL to trade above $180, a new three-month high.
Several key factors have driven this remarkable performance, including significant whale activity, rising expectations for a possible exchange-traded fund (ETF), and a substantial increase in the total value locked (TVL) on Solana’s network.
In this context, cryptocurrency analyst Rekt Capital highlighted that, based on technical indicators and historical performances, Solana is poised for a possible rally to claim the $202 mark.
Technical patterns and key levels to watch
According to Rekt Capital’s analysis, the chart pattern indicates two crucial resistance levels for Solana. The first major resistance level is at $180, which has recently been breached by a green-circled weekly candle close, signaling a bullish breakout.
Historically, a close above resistance often turns it into new support, suggesting a potential continuation of the upward trend. The next significant resistance level to watch is at $202. Breaking above this level would confirm the bullish sentiment and potentially lead to further gains.
The $135 level has proven to be robust support, as confirmed by previous successful retests.
This level is crucial as it has provided a strong foundation for price rebounds. Another support level is identified at $122, providing a safety net for any potential price corrections. The recent price action shows $135 as a successful retest, solidifying this level as a key support.
Volume analysis and potential trend continuation
Volume analysis further supports the bullish outlook. The lower section of the chart indicates substantial volume support at $19.54, $13.29, and $9.92, suggesting strong historical buying interest. The recent price movements accompanied by increased volume indicate sustained buying pressure, reinforcing the positive sentiment.
For the potential trend continuation, a successful retest of the $180.28 level as new support is critical. If Solana maintains this level, it could pave the way for further gains, targeting the next resistance at $202.84.
Breaking above this level could signal a continuation of the bullish trend, pushing the price higher.
Solana price analysis
As of the time of writing, Solana is trading at $175 with a daily decrease of over 3%, while on the weekly chart, SOL is up almost 11%.
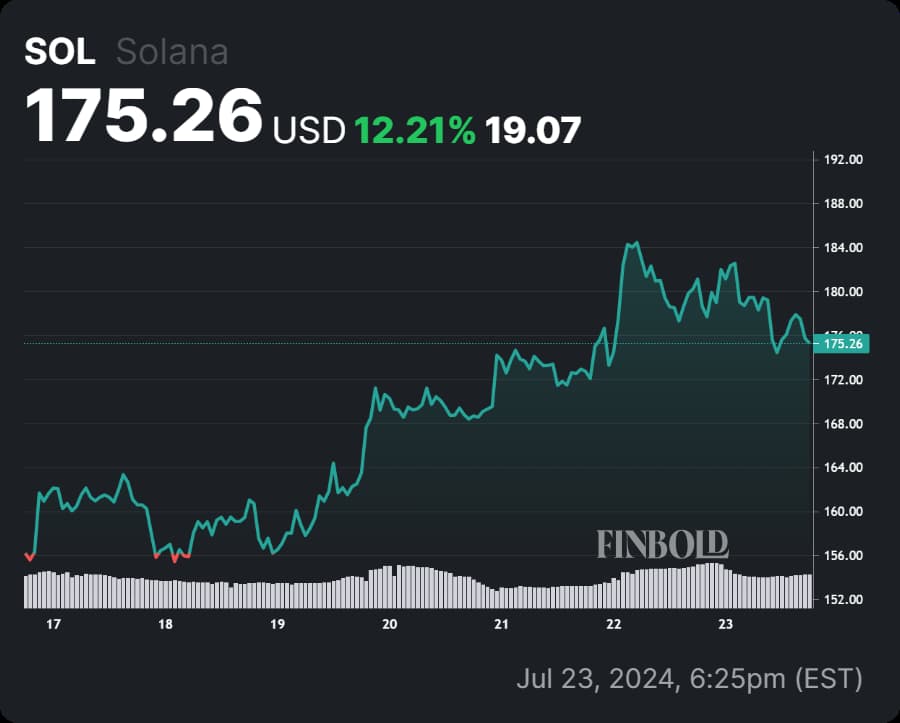

Despite the slight daily decline, the overall weekly performance remains strong, highlighting the ongoing bullish sentiment in the market.
Investors and traders should monitor the key support and resistance levels closely to make informed trading decisions.
Disclaimer:The content on this site should not be considered investment advice. Investing is speculative. When investing, your capital is at risk.
Read the full article here


 Signal, Bitcoin (BTC) Crucial $60,000 Resistance Reached")
 Cryptos Outshining This Week")


