Crypto Price Prediction: The cryptocurrency market is experiencing relative stability during the weekend, following a bearish trend earlier in the week. This downturn saw Bitcoin, the largest cryptocurrency, fall from a high of $49,000 to $40,300, marking a 17.85% loss.
This selling pressure is largely attributed to Grayscale beginning to sell its Bitcoin holdings in response to investors offloading shares of the GBTC ETF. The outflow of $2.2 billion from Grayscale’s GBTC and concerns about the Bitcoin ETF being a ‘sell-the-news’ event have led most major cryptocurrencies into a correction phase.
Despite this, several industry experts view the current downturn as a natural correction, necessary for the major cryptocurrencies to gather strength for future growth.
Bitcoin Price| TradingView Chart
On the Bitcoin weekly time frame chart, there’s a notable struggle to sustain above the 50% Fibonacci retracement level, around $42,300. This effort to reclaim 50% of the lost value from the recent downtrend reflects a growing conviction among market bulls and a weakening hold by bears on the asset.
With a positive outlook for the near future, the following cryptocurrencies Ethereum(ETH), Solana(SOL), and Luna Classic (LUNC) can offer suitable pullback opportunities to traders.
Why Ethereum (ETH) Price Nearing a 22% Breakout Rally

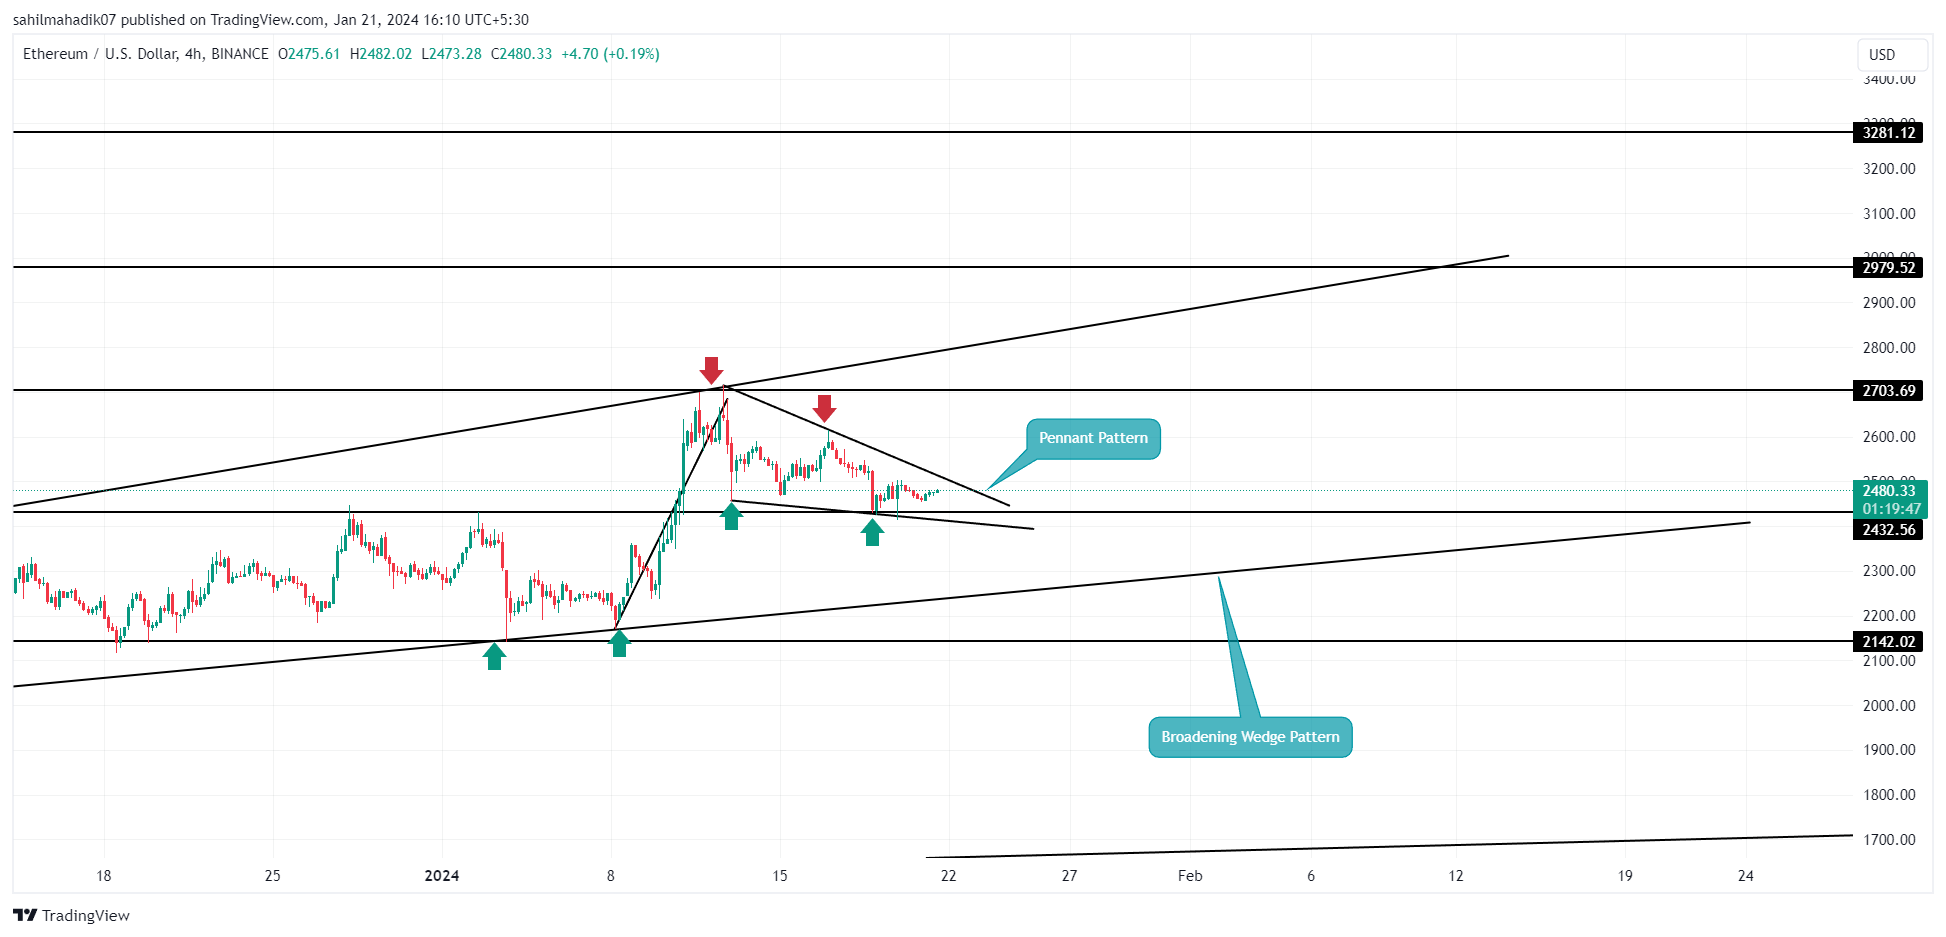
Ethereum (ETH) Price| TradingView Chart
Amid the current downturn in the crypto market, the Ethereum price recently hit a local high of $2700 before starting a correction phase this week. The price now stands at $2487, reflecting a loss of 8.35% over the past two weeks.
A closer examination of the 4-hour chart reveals that this correction is contained within two converging trendlines, forming what appears to be a pennant pattern. If this pattern proves accurate, it suggests that the current correction phase could be a consolidation period, allowing buyers to gather strength for a potential upward movement.
Adding to this bullish perspective is a notable observation by Ki Young Ju, CEO of CryptoQuant, regarding Ethereum’s staking activity. On January 18th, he highlighted in a tweet that 24% of Ethereum’s total supply is now staked, with only 11% available on exchanges. Contrary to expectations of significant unstaking post the Shapella upgrade, the staking rate continues to rise.
Given these technical and on-chain developments, the ETH price might break through the pennant’s upper trendline, indicating an end to the correction phase. This breakout could potentially spark a rally of around 22%, pushing the price beyond the $3000 mark..
New Found Support Bolsters Solana (SOL) Price Rally to $125, But There’s More
Solana (SOL) Price| TradingView Chart
Solana, the fourth largest cryptocurrency by market cap, has displayed impressive resilience amid the broader market’s downturn, holding steadily above the crucial $85 mark. This level coincides with the 38.2% Fibonacci retracement, signaling that buyers are maintaining a strong foothold.
As highlighted in a recent analysis by Coingape, the Solana price correction is shaping the ‘handle’ of a larger Cup-and-Handle pattern, a bullish chart formation. This suggests that the ongoing retracement could rejuvenate the bullish momentum, potentially driving the SOL price up by 35% to breach the critical neckline resistance at $125.
A successful breakout from this neckline, particularly if backed by a daily candle closing above it, would be a robust indication of a trend reversal. Such a development could set the Solana price on a path towards a significant target of $255.
Terra Classic (LUNC) Price Wavering In a Mark-or-Break Scenario
Terra Classic (LUNC) Price| TradingView Chart
The Terra Classic (LUNC) price has been in a corrective phase since December 2023, with its price dropping from a high of $0.00028 to its current value of $0.000118, indicating a substantial 60% loss.
The coin found crucial support at the 78.6% Fibonacci retracement level around $0.0000102, changing its course from a downward trend to sideways. The daily chart shows that this consolidation has evolved into a symmetrical triangle pattern, typically a sign of the continuation of the existing trend.
A breakdown below this triangle’s lower support trendline might lead to further price declines for LUNC, potentially towards $0.0000975 and then $0.0000842. Alternatively, a rare upside break from this pattern could signal an attempt by buyers to regain bullish momentum.
If buyers manage a breakout, they could be looking at an upward rally towards resistance levels at $0.000147, followed by $0.000173, providing a much-needed boost to reverse the bearish sentiment.
Related Articles:
- Crypto Headlines of the Week: Bitcoin ETFs Advance, Binance & Terra Propel Speculations
- Bitcoin ETF Options Spark New Crypto Wave, Say Experts
- Crypto Prices Today: Bitcoin (BTC) Price Rises Above $41,500, Ether Edges Higher While Pepe Declines
Read the full article here

