Crypto price prediction: Cryptocurrencies led by Bitcoin continue to wobble more than a week after BTC ETFs were approved in the US. Entries have become vaguely elusive, pushing traders and investors into the sidelines, at least until the market stabilizes.
Crypto analysts are conflicted, with some expecting a deeper sweep below $40,000 to $38,000 in the price of Bitcoin. Michaël van de Poppe, a renowned trader, for instance, reckoned via a post on X that BTC price will likely continue to consolidate. He also argued that as Bitcoin consolidates, attention will shift to altcoins.
I’m still on the same thoughts with #Bitcoin.
Consolidating here, which means that we’ll have a higher return on altcoins than Bitcoin.
Short-term resistance at $46K, expecting to see a support test at $38-40K. pic.twitter.com/WdQBSrPSnS
— Michaël van de Poppe (@CryptoMichNL) January 18, 2024
Turning to altcoins could offer investors limitless opportunities to capitalize on the expected market upturn in 2024. Hence, this article will delve into three promising tokens that could blow out the performance of crypto portfolios, starting with Polygon (MATIC), Arbitrum (ARB), and Lido DAO (LDO).
Polygon (MATIC) Flaunts Profitable Dips
Polygon is diving deeper into the abyss trimming the more than 45% increase in value from the beginning of December to the month’s peak at $1.09. This prominent Ethereum layer 1 scaling solutions provider is back on the drawing board with the decline seemingly unstoppable.
Holding below all three applied MAs; the 20 Exponential Moving Average (EMA), the 50 EMA, and the 200 EMA, the path of least resistance is vividly downwards.
A sell signal from the Moving Average Convergence Divergence (MACD) spoils the broth for the bulls while tipping the scales in the sellers’ favor. Traders would prefer to keep shorting MATIC as long as the MACD line in blue holds below the signal line in red while the momentum indicator generally slides to lower levels — currently at -0.012.
MATIC price chart | Tradingview
Identifying opportunities is every investor’s litmus test. Therefore, with Polygon below the 78.6% Fibonacci level, a trend reversal could be in the offing. The token is highly oversold, which implies that the next sign of support could attract investors ready to apply the dollar-cost average (DCA) strategy. With this, soaring demand for MATIC would start to repair the technical structure and point Polygon above $1 and eventually toward ATH.
Arbitrum (ARB) Screams More Pain, But There’s Hope
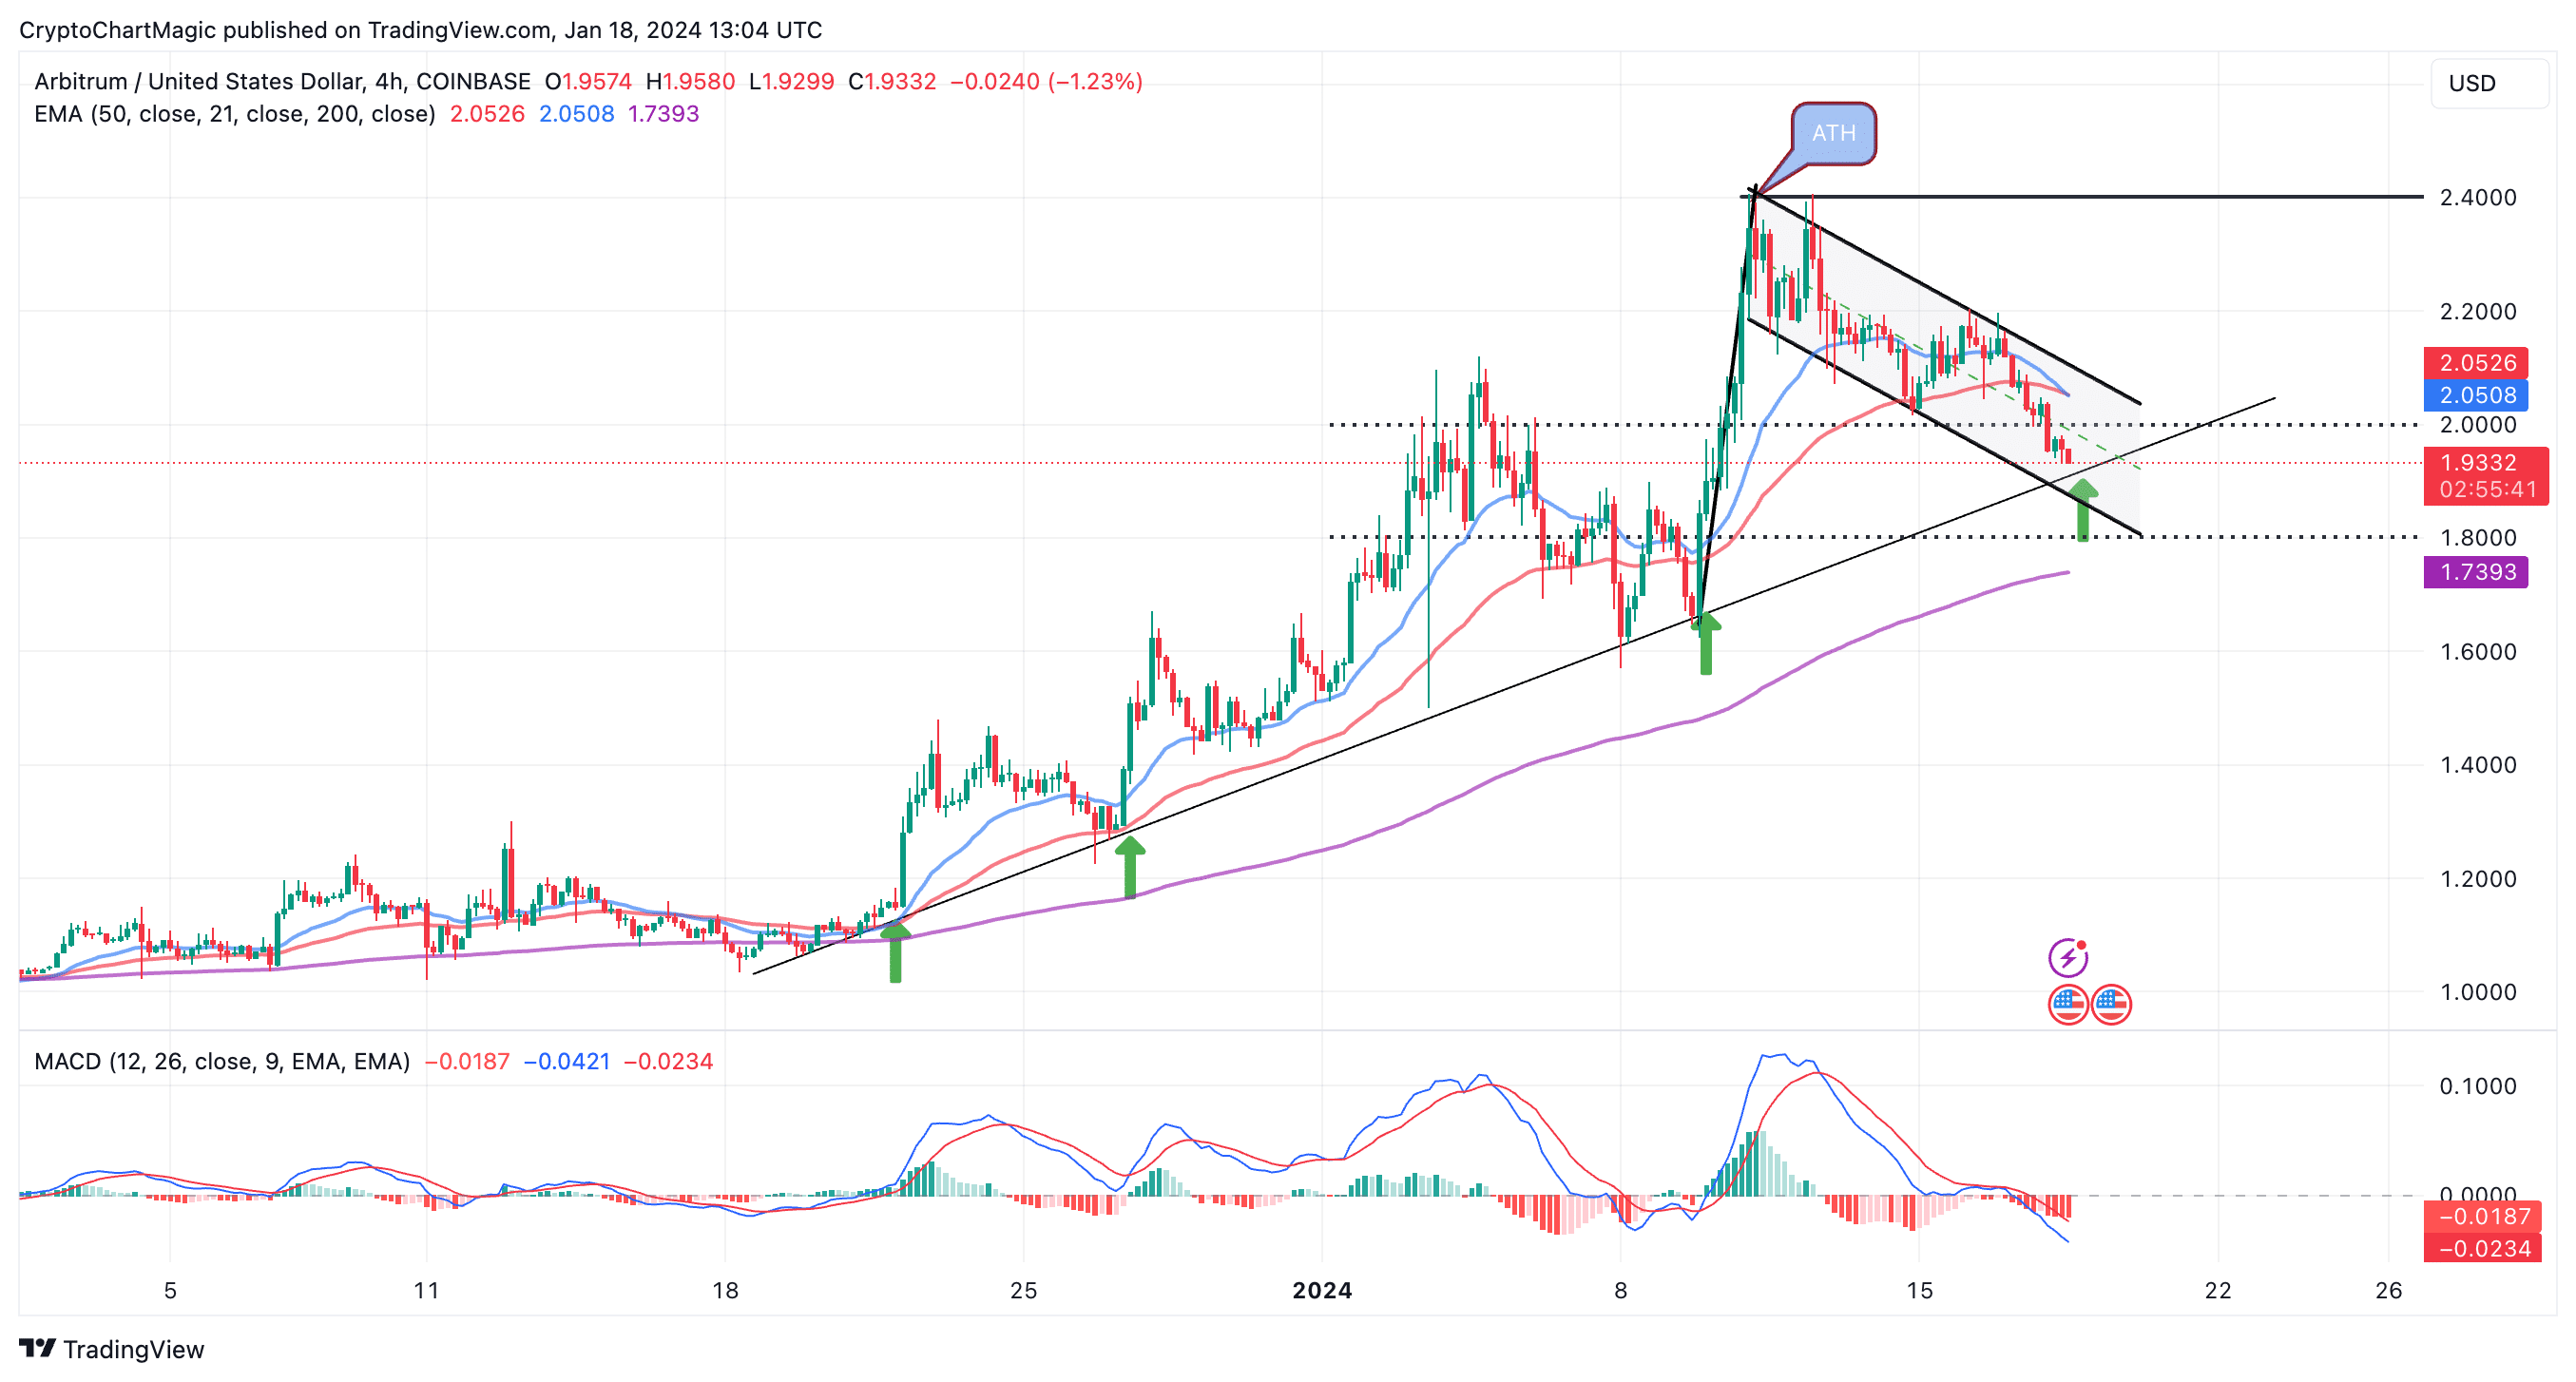
One of the fastest-growing projects in the Ethereum ecosystem, Arbitrum, heavily rewarded holders during the Q4 run, which saw it rally from $0.76 in October to a new record high posted at $2.4 in January.
Following such a massive price increase, it is normal for a correction to occur. This can be fuelled by profit-taking activities or general market drawdown. In the Arbitrum case, the dive to $1.9 is a result of both factors.
Although it is possible for ARB to resume the uptrend above $2, the prevailing technical outlook on the four-hour chart paints a short-term grim picture.

ARB price chart | Tradingview
First, the MACD dons a sell signal, and coupled with the red histograms, it could, this may encourage more selling among investors. The 20 EMA crossover below the 50 EMA compels traders to avoid long positions and even consider shorting ARB.
However, what many may fail to notice is that the ongoing correction could offer important opportunities, especially to investors who missed the rally to $2.4.
The chart shows the potential for a rebound from the ascending trendline. Each time ARB has dropped to this line, it has forcibly ticked up, reversing the trend. The trendline aligns with the channel support at $1.9 but if push comes to shove, ARB could dip further to $1.8 and $1.6. A DCA strategy at these key levels could be the best way to seek exposure and make the most out of the dips.
Is It A Good Time To Buy Lido DAO (LDO) Dips?
Investors interested in Ethereum-based tokens may want to consider Lido DAO. This is the most significant token in the liquid staking arena. Its prominence in the sector saw it explode to $4 this month.
Despite the current retracement to $3.1, LDO still maintains a 48% increase in the last 30 days.
A descending channel is guiding the correction, which extends below the key ascending trendline. Lido price bounced off this line several times in December and January. Therefore, losing it as a support could have a far-reaching impact on the token’s performance.
LDO price chart | Tradingview
With support at the channel’s middle boundary shaky, investors should be looking towards the 200 EMA at $2.9 for an immediate reversal. However, it is too early to rule out a possible dive to $2.6.
The MACD could also guide investors on when to go all-in on LDO. A bit signal would manifest with the blue MACD line crossing above the red signal line. On the upside, LDO’s potential could go far more than the recent high, considering it hit an ATH of $7.3 in 2021.
Related Articles
- LUNC News: Here’s Why Terra Luna Classic EVM & Validator Proposals Failed
- Solana Meme Coin MYRO Flips PEPE In 24-Hour Volume, Price Soars 65%
- Here’s Why Ethereum Price May Outperform Bitcoin Recovery in Near-Term
Read the full article here

