


Amidst the broader market’s recovery from the initial downturn triggered by ETF approvals, the Chainlink price has successfully maintained its position above the $13.6 local support level. This positive turnaround from the support level has resulted in a significant 13.6% increase in the LINK price over the past week, bringing it to a current trading price of $15.46.
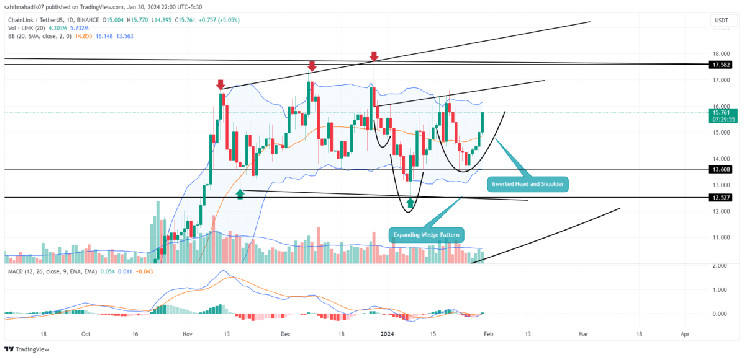
Examination of the daily chart reveals that this upward trend is shaping into a bullish chart pattern known as an inverted Head and Shoulders, presenting an opportunity for buyers to capitalize on the potential for further recovery
High Momentum Rally Sets Chainlink Price For Key Resistance Breakout
- The LINK price rising for five consecutive days reflects an active buying activity among traders.
- The rising price will face a high supply zone at the $17.5 resistance
- The intraday trading volume in the LINK coin is $495 Million, indicating a 32% gain.
Chainlink Price| TradingView Chart
Over the last three months, the Chainlink price has experienced significant volatility, fluctuating within two diverging trendlines. This movement, visible on the daily chart, indicates a sideways trend, suggesting a lack of clear direction from buyers or sellers from a technical perspective.
However, contrasting insights emerge from on-chain metrics regarding largeholder activities. A recent analysis by Intotheblock, a crypto analytics firm, revealed that large holders have significantly increased their holdings of LINK, accumulating over 57 million $LINK in the last 30 days.
This notable accumulation could indicate a strengthening confidence in Chainlink or a strategic investment approach.
Large Chainlink holders added more than 57M $LINK to their balances in the last 30 days. pic.twitter.com/bnlIJdTEbN
— IntoTheBlock (@intotheblock) January 30, 2024
In light of these developments, there’s an anticipation that the LINK price may rise by an additional 7% shortly, aiming to breach the pattern’s neckline resistance at $16.67. If this breakout is successful, it could lead to heightened buying pressure, potentially pushing the price beyond the $17.5 resistance of the recent high.
Securing this new level could empower buyers to pursue an ambitious target of $30.
Technical Indicators
- Bollinger Band: An upswing in the lower boundary of the Bollinger band indicator provides additional support for buyers
- Moving Average Convergence Divergence. A bullish crossover between MACD(blue) and signal(orange) at the neutral zone, indicates the asset is returning to a recovery trend.
Related Articles:
- Why Investors From Litecoin (LTC) And Chainlink (LINK) Have Joined The New DeeStream (DST) Presale
- Crypto Price Prediction For January 30: BTC, AVAX, SUI
- Bitcoin Price to Retest $48000 As Bullish Pattern Hints End of Correction
Read the full article here


 Signal, Bitcoin (BTC) Crucial $60,000 Resistance Reached")
 Cryptos Outshining This Week")


