


The Celestia (TIA) price has increased since January 13, validating a long-term ascending support trend line.
TIA is approaching the final resistance area before a new all-time high. Will it reach it in February?
Celestia Bounces at Long-Term Support
The technical analysis of the daily time frame shows that the TIA price has increased alongside an ascending support trend line since November 7, 2023. The upward movement culminated with a new all-time high price of $20.40 on January 15.
While TIA fell afterward, it validated the trend line and a horizontal support area on January 23, initiating the current bounce. So far, the trend line has existed for 90 days.
TIA/USDT Daily Chart. Source: TradingView
The daily Relative Strength Index (RSI) gives a bullish reading. Market traders use the RSI as a momentum indicator to identify overbought or oversold conditions and to decide whether to accumulate or sell an asset.
Readings above 50 and an upward trend indicate that bulls still have an advantage, whereas readings below 50 suggest the opposite. The RSI bounced at 50 while the TIA price bounced at the trend line, legitimizing the movement.
TIA Price Prediction: When Will Price Reach New All-Time High?
The six-hour time frame technical analysis also gives a bullish outlook. The chart shows that the TIA price trades inside an ascending parallel channel and has reclaimed the $17 horizontal area. The area will now be expected to provide support.
The six-hour RSI is above 50 and increasing, legitimizing the upward movement.
Cryptocurrency trader and analyst Altcoin Sherpa states that TIA is accumulating before its next leg up. They tweeted:
$TIA: I think that you can just scale into this current consolidation range if this is one you like. You can see that these strong movers have large periods of chop followed by the next drive. Not really 1 to day trade but more of a swing/investment IMO.
If TIA continues to move upwards, it can reach the next resistance at $20, 10% above the current price. This is the final resistance area before a new all-time high and coincides with the channel’s resistance trend line.

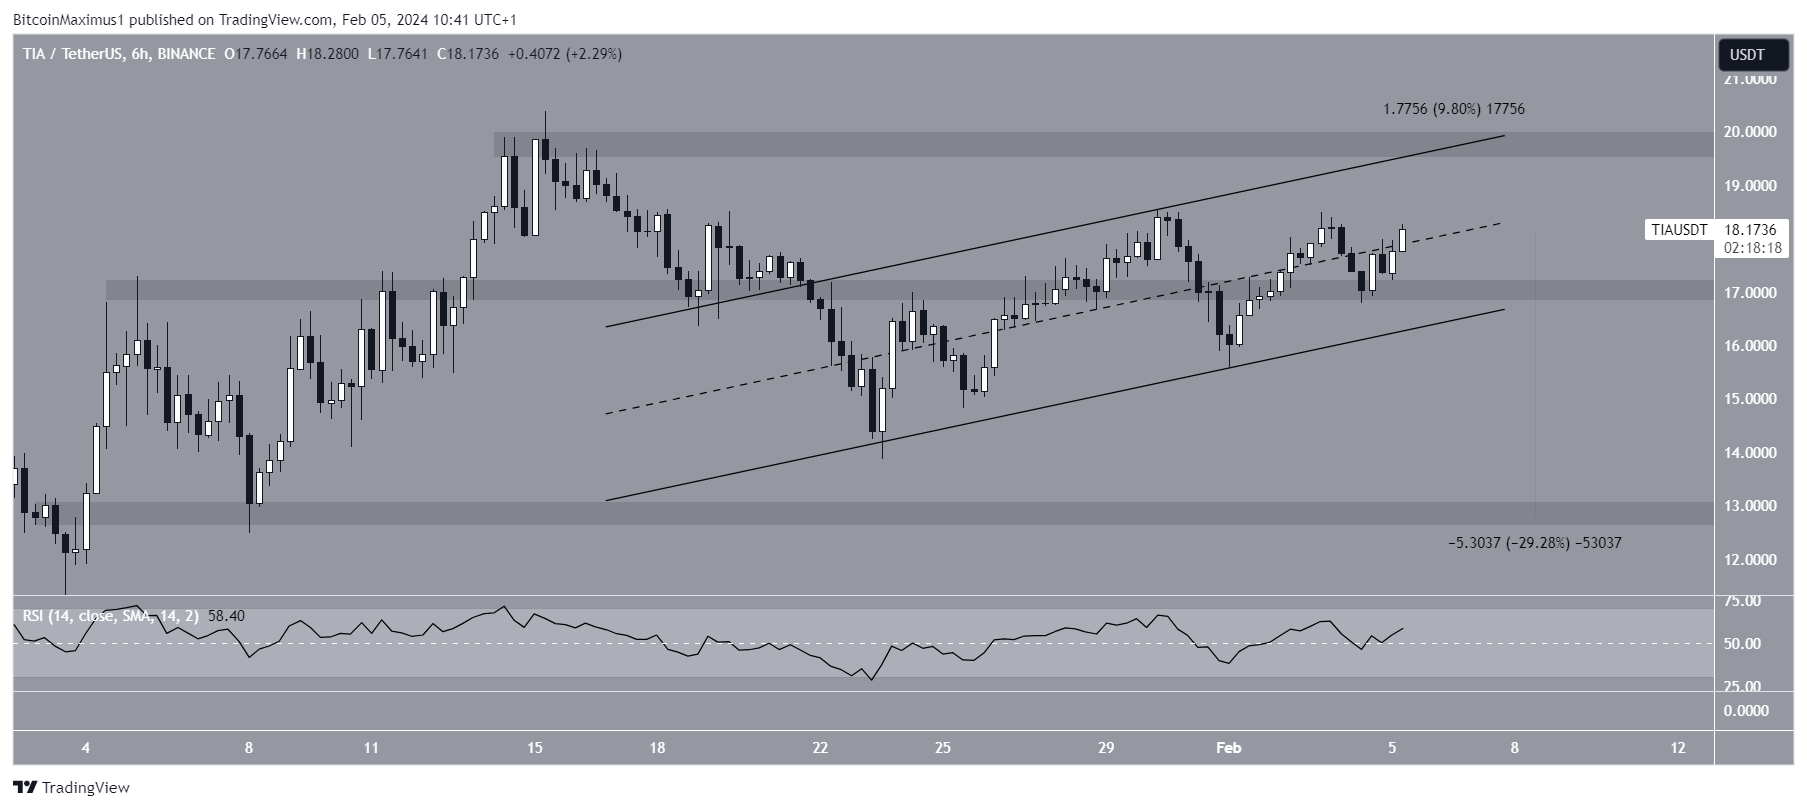
TIA/USDT Six-Hour Chart. Source: TradingView
Despite this bullish TIA price prediction, a close below $17 will invalidate the bullish thesis and could cause a 30% drop to the nearest support at $13.
For BeInCrypto‘s latest crypto market analysis, click here.
Disclaimer
In line with the Trust Project guidelines, this price analysis article is for informational purposes only and should not be considered financial or investment advice. BeInCrypto is committed to accurate, unbiased reporting, but market conditions are subject to change without notice. Always conduct your own research and consult with a professional before making any financial decisions. Please note that our Terms and Conditions, Privacy Policy, and Disclaimers have been updated.
Read the full article here


 Signal, Bitcoin (BTC) Crucial $60,000 Resistance Reached")
 Cryptos Outshining This Week")


