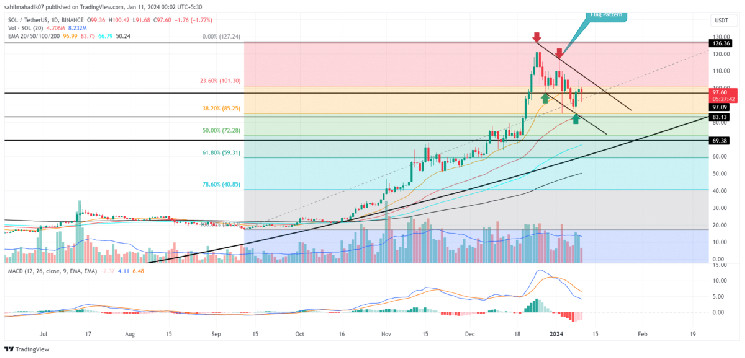
Solana Price Prediction: Amid the recent market uncertainty surrounding spot Bitcoin ETF approval, the Solana price witnessed a notable correction in the last two weeks. From the new local top of $126.36, the coin price has plunged nearly 25% to currently trade at $94.58. However, a look at the daily time frame chart shows this correction has led to the development of a bullish Flag pattern which indicates the asset will rebound aiming for higher targets
Flag Pattern Could Resume Recovery in SOL Price
- A healthy retracement to 38.2% FIB reflects the overall trend of this asset remains bullish.
- A bullish breakout from the flag pattern will hint at the end of the correction end
- The 24-hour trading volume on the Solana coin is $3.3 Billion, indicating a 12% gain.
Solana Price Prediction| TradingView Chart
The parabolic growth in the fifth-largest cryptocurrency Solana entered a new correction when the price peaked at $126 in late December. This pullback had recently plunged the price to a low of $85, which coincides with the 38.2% Fibonacci retracement level.
However, a steady lower-high, lower-low formation in the daily time frame showcased the formation of a bullish reversal pattern called FLAG. Following this pattern, the current retracement could be a temporary pullback to replenish the exhausted bullish movement pattern and prepare buyers for the next leap.
If the spot Bitcoin ETFs is approved this week, the altcoin market will receive a significant inflow along with the BTC price. This could bolster the SOL price to breach the overhead resistance trendline of the flag pattern, offering buyers a suitable springboard to resume the recovery trend.
As per the Fibonacci extension, the spot-breakout rally could surge the altcoin by 58% to hit a potential target of $152.
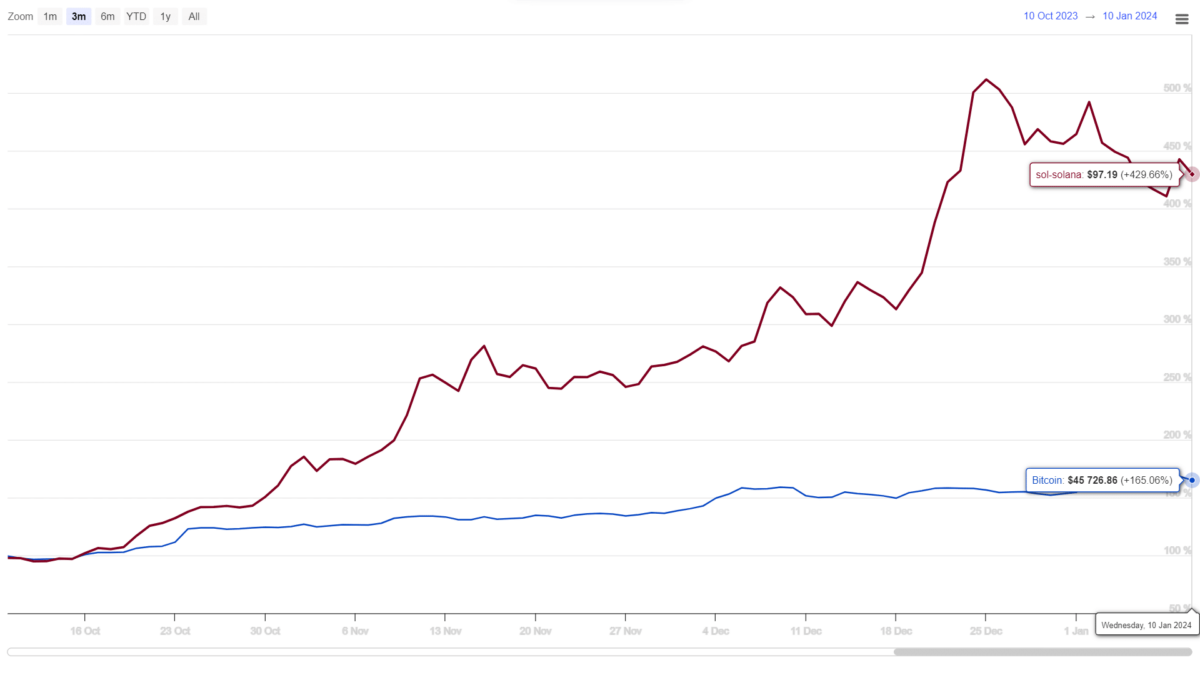
SOL vs BTC Performance

Over the past three months, both Solana and Bitcoin have exhibited bullish price trends. However, a distinct difference is observed in their recovery patterns. Solana (SOL) experienced a more vigorous recovery, marked by significant retracements that are advantageous for pullback trading strategies. On the other hand, Bitcoin, the leading cryptocurrency, demonstrated a steadier and more gradual upward trend, which is more suitable for breakout trading strategies.
- Exponential Moving Average: The 50-day EMA could continue to offer pullback support to buyers.
- Moving Average Convergence Divergence: A bearish crossover state between the MACD and signal reflects no sign of reversal yet in SOL from a price perspective.
Related Articles:
- Scam Alert: Crypto Hackers Lure Ethereum, Solana & Tron Communities Into Fake Airdrop
- Breaking: CBOE Approves Multiple Spot Bitcoin ETFs for Trading
- Bitcoin ETF: Will SEC Brief Press on Decision After Market Close?
Read the full article here

