The Shiba Inu (SHIB) price has nearly reached the resistance trend line of a long-term pattern.
The price broke out from a short-term corrective pattern. Can this be the start of a new bullish rally?
Shiba Inu Nears Long-Term Resistance
The weekly time frame technical analysis shows that the SHIB price has fallen under a descending resistance trend line since August 2022.
More recently, the trend line rejected the SHIB price in August (red icon), leading to a low of $0.0000066 in October.
The SHIB price could also be trading inside a descending wedge. However, its support line (dashed) has not been validated sufficient times. So, the SHIB price pattern is not confirmed yet.
Read more: Shiba Inu (SHIB) Price Predictions
Examining the Relative Strength Index (RSI), a crucial momentum indicator to analyze market conditions, it shows an uncertain reading for SHIB.
Typically, an RSI above 50 during an upward trend indicates bullish control, while an RSI below 50 suggests the opposite.
In the case of SHIB, the RSI is rising but remains below 50, indicating an undetermined trend.
SHIB/USDT Weekly Chart. Source: TradingView
The Shiba team made a positive announcement this week, stating that:
“Big News! The Shib Magazine is here, your weekly ticket to the world of tech, finance, and more. Get your free NFT magazine cover for the first 1000 readers at https://news.shib.io#TheShibMagazine.”
Read more: Shiba Inu – A Beginner’s Guide
SHIB Price Prediction – Can Breakout Initiate Reversal?
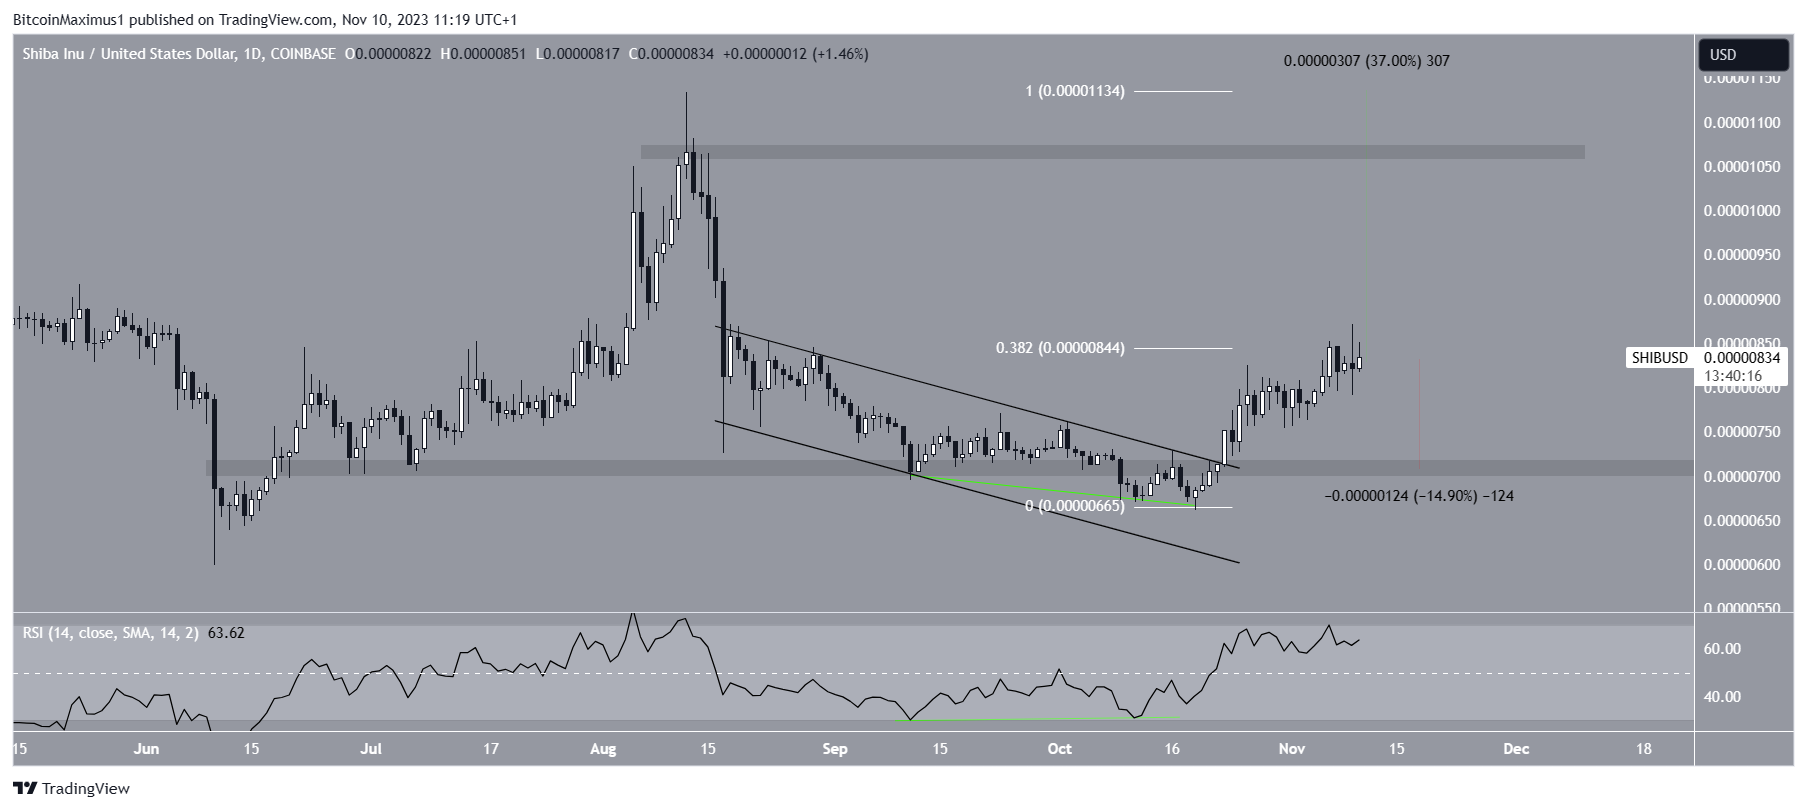
The daily timeframe analysis presents a more optimistic outlook for the altcoin.
Until Aug. 14, SHIB’s price had been confined within a descending parallel channel, typically associated with corrective actions, hinting at a potential breakout.
On Oct. 22, SHIB successfully surpassed the trend line. This uptick was accompanied by a bullish divergence in the RSI (green), indicating a momentum increase following a price decrease.
Moreover, the RSI crossing above 50 suggests that the breakout in Shiba Inu is genuine and could lead to further upward movements.
Should the positive momentum persist, SHIB’s price might see a 37% increase, reaching the next resistance level at $0.0000110 and potentially triggering a breakout from the long-term descending resistance trend line. This could initiate a more prolonged bullish trend reversal.

SHIB/USDT Daily Chart. Source: TradingView
Despite this optimistic SHIB price prediction, a failure to breach the 0.382 Fib retracement resistance level at $0.0000085 could result in a 15% decline, confirming the short-term horizontal support at $0.0000070.
For BeInCrypto‘s latest crypto market analysis, click here.
Read the full article here

