This month has been good, with several cryptos posting gains over the 30 days.
Bitcoin price analysis
Bitcoin (BTC), the number one crypto in the world, led the way with massive gains over the period as Bitcoin price stood at $38.8K as of press time, trading 11% above its previous 30-day price.
Volatility levels on Bitcoin Price have been relatively low over the month, as seen from the Bollinger bands movements, which have been close according to the monthly charts. The RSI is moving above its average line, showing bull dominance over the month on Bitcoin price.
BTC 1-day chart | Source: TradingView
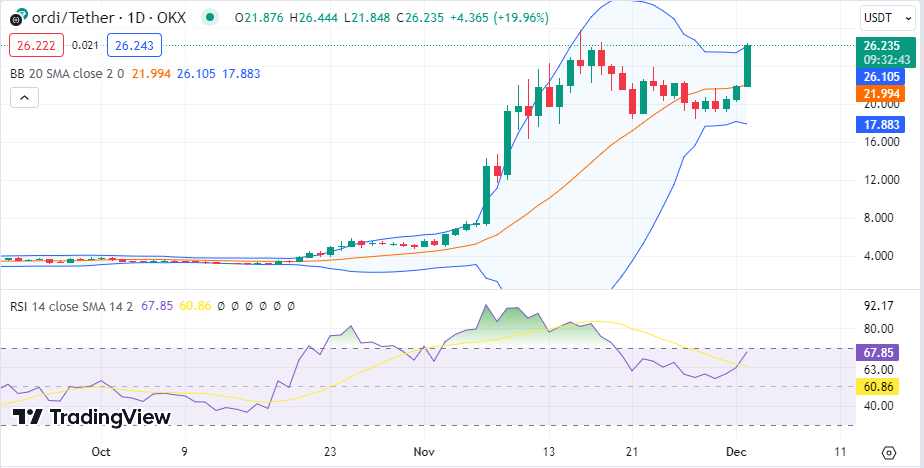
ORDI price analysis
ORDI (ORDI) also saw massive gains over the period as ORDI price stood at $26.08 as of press time, trading 394% above its previous 30-day price.
Volatility levels on ORDI Price have been high over the month, as seen from the Bollinger bands movements, which appear to be diverging. The RSI is moving above its average line close to the overbought region, showing bull dominance over the month on ORDI price.

ORDI 1-day chart | Source: TradingView
Celestia price analysis
Celestia (TIA) has also seen massive gains over the period as the Celestia price stood at $8.5K as of press time, trading 256% above its previous 30-day price.
As seen from the Bollinger bands movements, which are currently close, volatility levels on Bitcoin Price have been high over the month, which now seem to diverge. The RSI is moving above its average line in the overbought region, showing bull dominance over the month on Celestia price.
TIA 1-day chart | Source: TradingView
IOTA price analysis
IOTA (IOTA) is also on bull activity as the IOTA price stood at $30.2803 as of press time, trading 74% above its previous 30-day price.
Volatility levels on IOTA Price have been high over the month, as seen from the Bollinger bands movements, which are diverging. The RSI is moving above its average line in the overbought region, showing bull dominance over the month on the IOTA price.
IOTA 1-day chart | Source: TradingView
Osmosis price analysis
Osmosis (OSMO has also seen gains over the period as the Osmosis price stood at $0.7055 as of press time, trading 94% above its previous 30-day price.
Volatility levels on the Osmosis Price have been relatively low over the month, as seen from the Bollinger bands movements, which have been close according to the monthly charts. The RSI is moving above its average line close to the overbought region, showing bull dominance over the month on the Osmosis price.
OSMO 1-day chart | Source: TradingView
Read the full article here

