Bulls and bears are still struggling for control of the markets, as seen from the global market cap, which has dropped by 0.15% from its previous 24-hour one, as the total cap stood at $1.55T as of press time. The fear and greed index is 50, as neutrality strikes.
Bitcoin Price Analysis
Bitcoin has failed to post gains in today’s session, with the Bitcoin price at $39.9K as of press time, representing a 0.2% decrease in the last 24 hours to bring the weekly drop to 3.5%. Bitcoin’s trading volume has dropped by 12% over the same period to stand at $17.9B.
An in-depth analysis of 24-hour BTC/USD charts reveals bulls are now in control. This is seen from the Relative Strength Index, which is on a northern trajectory, showing bull action on BTC. The MACD indicator, on the other hand, is reverting towards the green zone, showing bull action on the Bitcoin price as well.
BTC 1-day chart | Source:TradingView
Ethereum Price Analysis
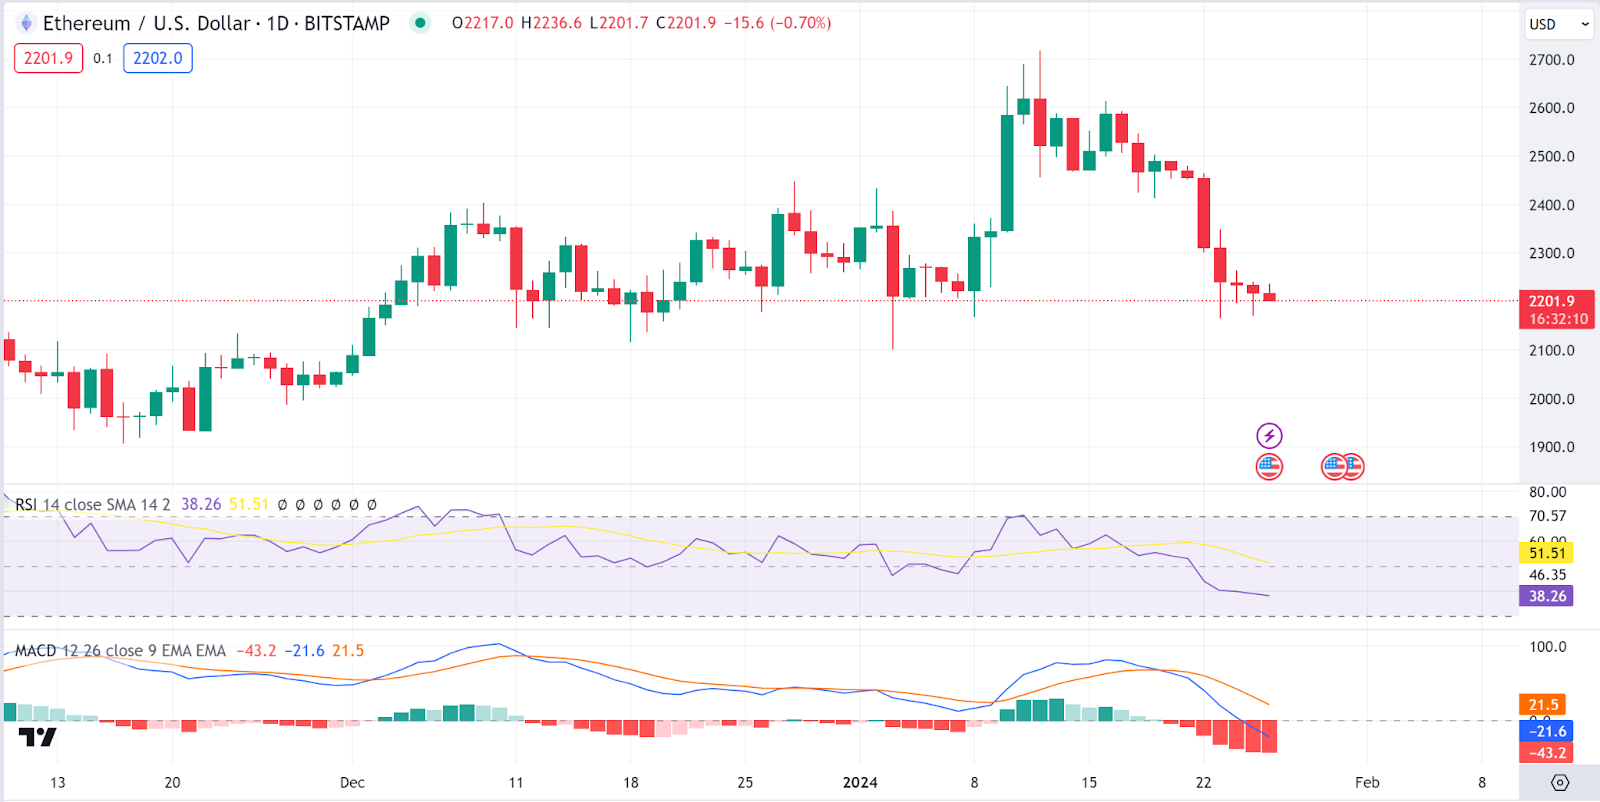
Ethereum (ETH), the altcoin king, has also failed to post gains as the Ethereum price stood at $2205 as of press time, representing a 0.7% decrease in the last 24 hours as the weekly drop stood at 10.6%. The trading volume has jumped by 0.11% to $9.2B.
An in-depth analysis of 24-hour ETH/USD charts also shows that bears control ETH markets, as shown by the Relative Strength Index indicator, which is currently on a southern trajectory. This asserts selling pressure on the Ethereum price. On the other hand, the MACD indicator is moving in the red zone, backing bearish prospects on the Ethereum price.

ETH 1-day chart | Source:TradingView
Ethereum Name Service Price Analysis
Ethereum Name Service (ENS) is our first gainer today as the Ethereum Name Service price stood at $19.8 as of press time, representing an 8.2% increase in the last 24 hours as the weekly drop stood at 3.5%. The trading volume has jumped by 11% to $161M.
An in-depth analysis of 24-hour ENS/USDT charts shows bull dominance on ENS markets, as shown by the Relative Strength Index indicator, which is currently on a northern trajectory as it heads for the overbought region. This asserts buying pressure on the Ethereum price. On the other hand, the MACD indicator is moving towards the green zone, backing bullish prospects on the Ethereum Name Service price.
ENS 1-day chart | Source:TradingView
OKB Price Analysis
OKB (OKB) is another gainer today as the OKB price stood at $51.3 as of press time, representing a 6.2% increase in the last 24 hours as the weekly drop stood at 4.6%. The trading volume has jumped by 190% to $22.7M.
An in-depth analysis of 24-hour OKB/USDT charts shows bull dominance on OKB markets, as shown by the Relative Strength Index indicator, which is currently on a northern trajectory as it heads for 50. This asserts buying pressure on the OKB price. On the other hand, the MACD indicator is moving towards the green zone, backing bullish prospects on the OKB price.
OKB 1-day chart | Source:TradingView
Pendle Price Analysis
Pendle (PENDLE) is our last gainer today as the Pendle price stood at $2.44 as of press time, representing a 0.5% increase in the last 24 hours as the weekly pump stood at 0.4%. The trading volume has jumped by 19% to $70.2M.
An in-depth analysis of 24-hour ENS/USDT charts shows bulls are losing grip of PENDLE markets, as shown by the Relative Strength Index indicator, which is currently reverting to Southern. This asserts building bear pressure on the Pendle price. On the other hand, the MACD indicator is moving towards the red zone, backing bearish prospects on the Pendle price.
PENDLE 1-day chart | Source:TradingView
Read the full article here

