The Dogecoin price seems to be in the early stages of a budding momentum with recent action in the past 48 hours. Particularly, a rebound has seen Dogecoin retesting the $0.34 price level in the past 24 hours. Notably, technical analysis of the Dogecoin price movement shows that the meme coin could now be gearing up for a remarkable move towards the $1 mark and beyond.
Dogecoin Price Retest Confirms Broadening Wedge Breakout
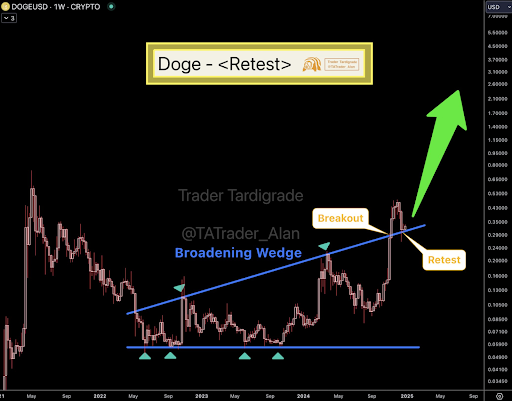
According to technical analysis, recent price action has seen Dogecoin complete a retest of a broadening wedge pattern. Notably, this interesting phenomenon was noted by crypto analyst Trader Tardigrade, who posted his analysis on social media platform X.
The broadening wedge formation is a generally bullish pattern that is associated with a remarkable price surge. This formation is associated with increasing highs and a relatively straight bottom. In the case of Dogecoin, the broadening wedge pattern has been in formation over a multi-year timeframe since May 2022.
Interestingly, Dogecoin’s performance in the last months of 2024 saw it breaking above the broadening wedge pattern. This breakout piggybacked upon a notable rally in October and November that eventually culminated in a short break above $0.48 in December. However, this break was short-lived, as Dogecoin went on a correction path in the last two weeks of December.
As shown in the Dogecoin weekly candlestick timeframe chart below, this correction saw it retest the upper end of this broadening wedge. Nonetheless, Dogecoin bulls have managed to prevent further price declines, with the meme coin now completing a retest in the past 24 hours. With this in mind, crypto analyst Trader Tardigrade predicts that this development could pave the way for a significant rally, with Dogecoin potentially targeting new highs of up to $2.6 in the near future.
Descending Triangle Breakout Hints At Short-Term Gains
In addition to the long-term broadening wedge setup, Trader Tardigrade also identified a descending triangle breakout in Dogecoin’s short-term price chart. This pattern, which was noted on the daily candlestick timeframe chart, also points bullish for Dogecoin.
Tardigrade remarked, “Dogecoin has broken out of the Descending Triangle at the bottom. This chart pattern could lead to an explosive surge for $DOGE afterwards.” Based on his analysis, the immediate price target for Dogecoin in this scenario is the $0.56 mark.
The convergence of these bullish chart patterns intensifies the bullish outlooks about Dogecoin’s price trajectory. Together, these breakouts create a compelling case for Dogecoin to resume its rally and eventually break above the $1 mark in the coming weeks. At the time of writing, Dogecoin has witnessed an increase in activity in the past few days. It is currently trading at $0.34 and is up by 5.5% in the past seven days.
Featured image created with Dall.E, chart from Tradingview.com
Read the full article here

