Shares Surged Nearly 9% in Extended Trading on Monday
Key Takeaways
-
Oracle shares surged nearly 9% in extended trading on Monday after the enterprise software company posted better-than-expected fiscal first-quarter results and announced a multicloud partnership with Amazon.
-
Bulls defended a retest of a prior trading range in early August before driving a rally of more than 11% from last month’s low ahead of the company’s quarterly results.
-
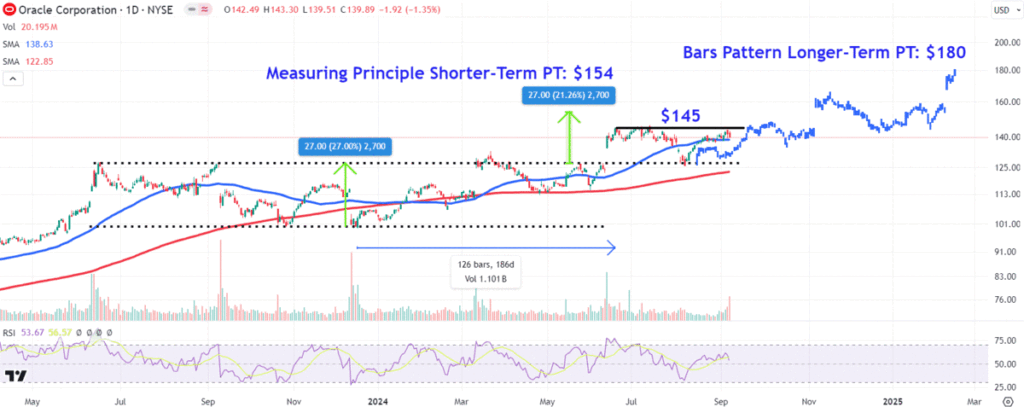
Investors should monitor shorter-term and longer-term price targets in Oracle shares at $154 and $180, respectively, while eyeing the $145 region as a potential retracement area.
Oracle (ORCL) shares surged more than 9% in extended trading on Monday after the enterprise software company posted better-than-expected fiscal first quarter results and announced a multicloud partnership with Amazon’s (AMZN) cloud business, Amazon Web Services.
The software giant’s stock has gained around 34% since the start of the year prior to Monday’s after-hours jump, as growing demand for its cloud services, particularly in artificial intelligence (AI) applications, has powered earnings in recent quarters.
Below, we’ll take a close look at the technicals on Oracle’s chart and point out important post-earnings price levels to watch out for. The stock rose 8.9% to $152.30 in after-hours trading Monday.
Bulls Defend Trading Range Retest
Oracle shares staged a decisive breakaway gap above 12-month trading range in mid-June but subsequently retraced the move throughout most of July to the initial breakout area. However, bulls stepped in to defend this important technical level in early August before driving a rally of more than 11% from last month’s low ahead of the company’s quarterly results.
Amid the stock’s projected jump to a new all-time high (ATH) following its upbeat report, investors can forecast both a shorter-term and longer-term price target using technical analysis.
Shorter-Term Price Target
We can forecast a shorter-term price target by using the measuring principle, sometimes referred to as the measured move technique.
This works by calculating the distance between the trading range’s upper and lower trendlines and adding that amount to the June breakout point. For instance, we add $27 to $127, which projects a target of $154.
Longer-Term Price Target
Investors can predict a longer-term price target by using a bars pattern.
We do this by extracting the stock’s upward trending move from December to June and position it from last month’s swing low. Doing so projects an upside target of around $180.
Moreover, that prior advance occurred over 126 trading days, indicating that the shares could remain in an uptrend until early February if a similar move were to play out.
Key Retracement Level to Watch
During retracements or periods of profit taking, investors should monitor how the price responds to the $145 level, an area on the chart that may flip from providing prior resistance into offering future support following the stock’s projected jump above this region on Tuesday.
The comments, opinions, and analyses expressed on Investopedia are for informational purposes only. Read our warranty and liability disclaimer for more info.
As of the date this article was written, the author does not own any of the above securities.
Read the original article on Investopedia.
Read the full article here

