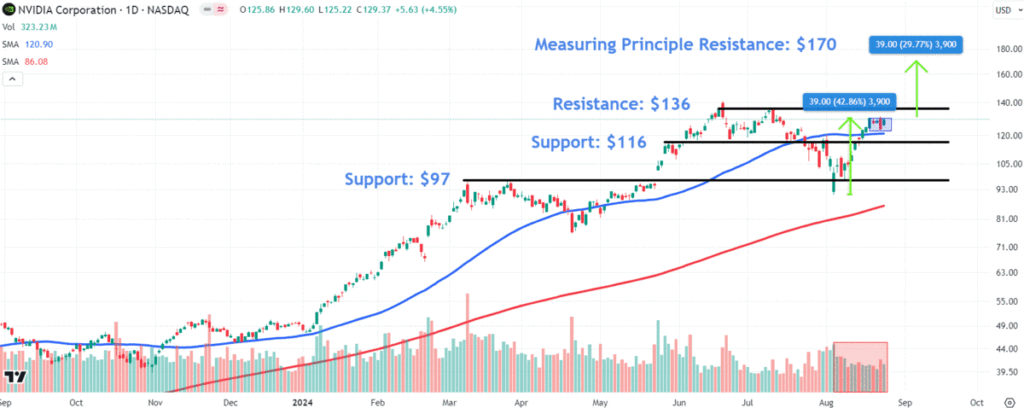
Shares Have Risen 43% From Early-August Low
Key Takeaways
-
Nvidia shares are in focus this week as the AI favorite prepares to release its highly anticipated quarterly earnings report on Wednesday. Investors will be looking out for sustained growth in the chipmaker’s data center segment and updates about its next-generation Blackwell chips.
-
The AI darling’s shares, which have surged 43% from their August low, have been bolstered in recent weeks by bullish Wall Street coverage and growing earnings forecasts.
-
The share price has recently consolidated within a rectangle formation, indicating a continuation of the chipmaker’s move higher.
-
Nvidia shares may encounter support around $116 and $97, but face resistance near $136 and $170.
Nvidia (NVDA) shares are in focus this week as the artificial intelligence (AI) favorite prepares to release its highly anticipated earnings report for its fiscal 2025 second quarter on Wednesday. Investors will be looking out for sustained growth in the chipmaker’s data center segment and updates about its next-generation Blackwell chips following reported delays.
The AI darling’s shares, which have surged around 43% from their August low, have been bolstered in recent weeks by bullish Wall Street coverage and growing earnings forecasts. The company, which has blown past expectations for both revenue and earnings in recent quarters, is under pressure to deliver another blockbuster quarterly report.
Below, we’ll take a closer look at Nvidia’s chart and use technical analysis to identify important price levels to watch out for amid the AI behemoth’s looming quarterly results.
Rectangle Formation Indicates Upside Continuation
Since staging an intraday reversal in early August to mark the end of a 26% correction from their record closing high, Nvidia shares have recovered the lion’s share of those losses. The price recently consolidated within a rectangle formation, indicating a continuation of the chipmaker’s move higher.
However, it’s worth noting that trading volumes remain below longer-term averages during the stock’s resurgence, pointing to possible apprehension by institutional investors ahead of the company’s quarterly results.
The stock gained 4.6% on Friday to close at $129.37.
Amid the potential for earnings-driven volatility in Nvidia shares this week, investors should eye these key support and resistance levels.
Support Levels to Watch
A breakdown below the rectangle pattern could see the shares initially test the $116 level, an area on the chart in close vicinity to the 50-day moving average where buyers could look for entry points near a horizontal trendline connecting a series of similar trading levels between May and July.
A deeper post-earnings retracement could spark a fall to $97, where the shares would likely attract significant support from two prominent price peaks that formed on the chart during March. This region also sits just a little above the stock’s correction low recorded during the early August broad-based market sell-off.
Resistance Areas to Monitor
Upon an upside breakout of the rectangle formation, the shares may encounter resistance around $136, where they could find investors willing to lock in profits near the June 18 record close, a level that also aligns with the stock’s July peak.
To forecast a potential resistance area above Nvidia’s all-time high (ATH), we can use the measuring principle. To do this, we calculate the distance of the trending move that preceded the rectangle and add that amount to the formation’s breakout point. In this case, we add $39 to $131, which projects a target of $170, a location where the shares may run into selling pressure.
The comments, opinions, and analyses expressed on Investopedia are for informational purposes only. Read our warranty and liability disclaimer for more info.
As of the date this article was written, the author does not own any of the above securities.
Read the original article on Investopedia.
Read the full article here

