GBP/USD Price Forecast: Hovers below nine-day EMA near 1.2500
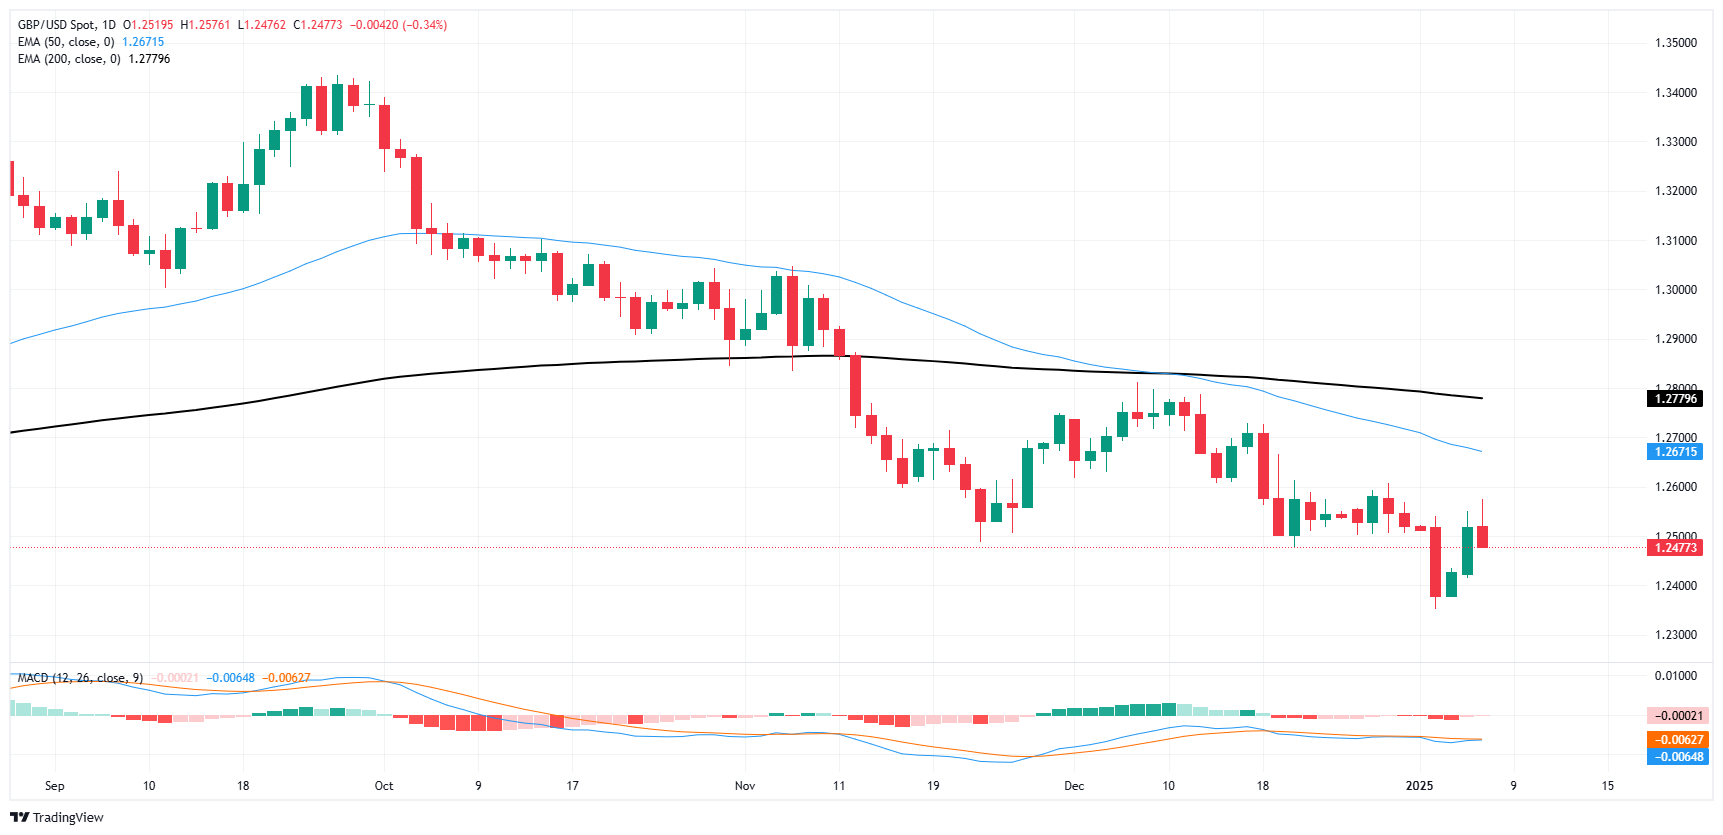
The GBP/USD pair maintains its position after registering losses in the previous session, hovering around 1.2480 during Wednesday’s Asian hours. Technical analysis on the daily chart points to a weakening bearish trend, as the pair is trading above the upper boundary of a descending channel pattern.
Despite this, the 14-day Relative Strength Index (RSI) remains below the 50 level, signaling continued bearish pressure. Furthermore, the pair is positioned below both the nine- and 14-day Exponential Moving Averages (EMAs), indicating weak short-term price momentum. A clear breakout above these EMAs could signal a shift from a bearish to a bullish outlook. Read more…
GBP/USD snaps two-day win streak as risk appetite stumbles
GBP/USD caught a mild bid early on Tuesday before turning south once again and shedding roughly one-third of one percent to end the day on the low side of the 1.2500 handle. Cable bidders continue to struggle to find reasons to hit the bids as a technical recovery falters after a tepid two-day bull run from 9-month lows near 1.2350.
It’s been a wobbly start to the new year on the Pound Sterling charts after ending 2024 with a three-month losing streak, and bidding momentum is hobbled near medium-term lows with a light data docket on the cards for Cable traders. UK Like-For-Like Retail Sales surged to 3.1% for the year ended in December, but GBP flows were unable to overcome a fresh bout of risk aversion after US Purchasing Managers Index (PMI) activity and business costs survey results shredded near-term hopes for continued rate cuts from the Federal Reserve (Fed) in early 2025. Read more…

Read the full article here

