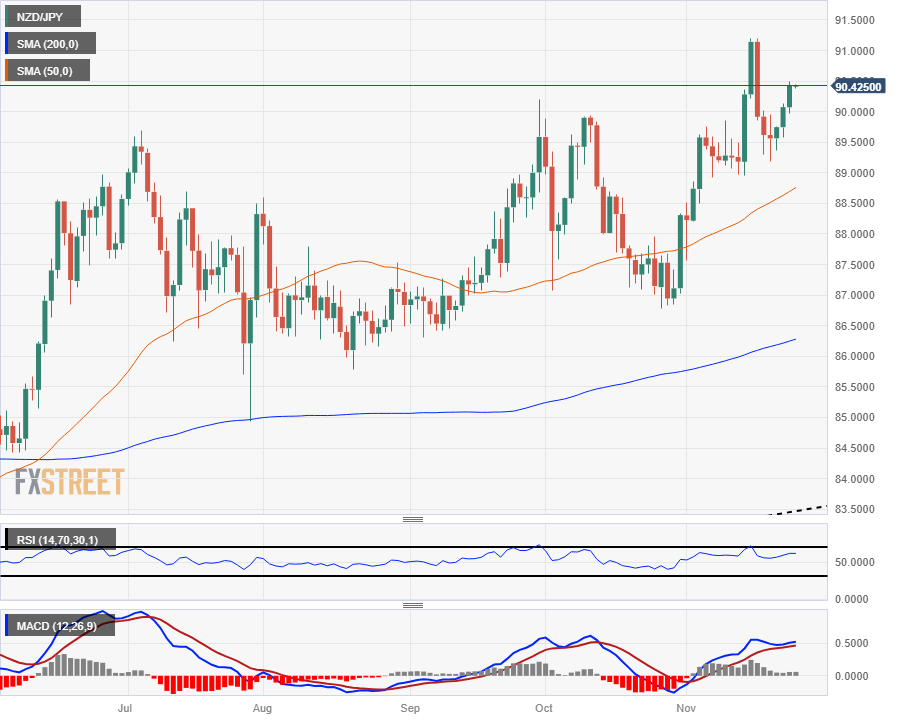
- The Kiwi has earned the dubious title of Thursday’s largest market mover.
- The NZD/JPY cleared almost half a percent in otherwise flat trading.
- Price action still capped underneath last week’s eight-year peak of 91.20.
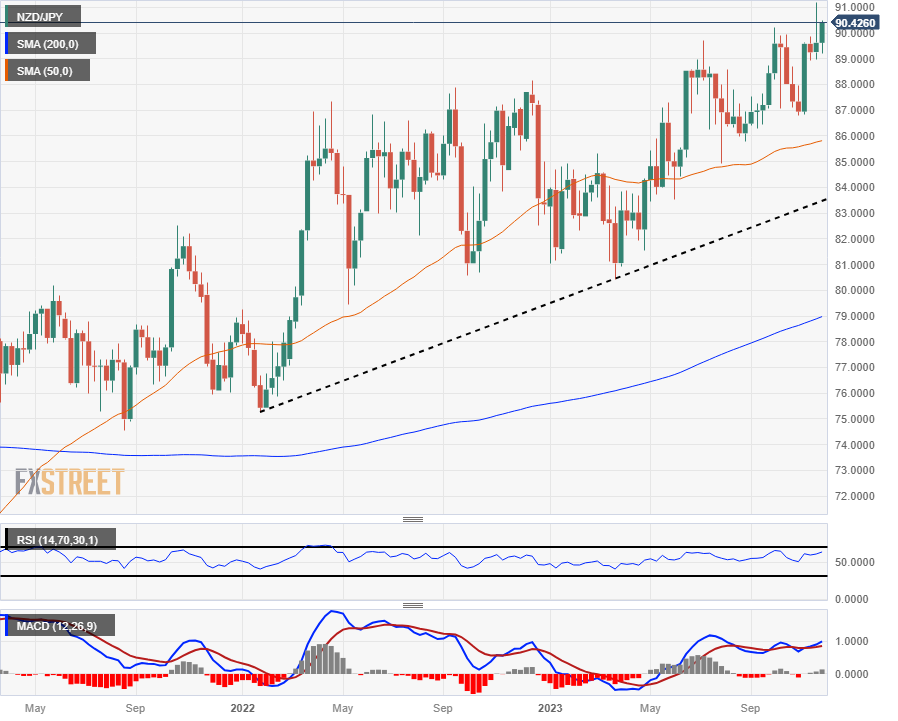
The NZD/JPY rolled up almost half a percent on Thursday as the Kiwi (NZD) sees a continuation of its climb up and over the Japanese Yen (JPY). The pair has closed in the green for three consecutive trading days and has pared back half of its losses after tumbling last week from an eight-year high of 91.20.
Hourly candles see the NZD/JPY trading bullish after catching a technical reversal from constrained 50- and 200-hour Simple Moving Averages (SMA) giving way to a bullish crossover.
The pair is now catching technical support from the 200-hour SMA lifting above 89.90 while the 50-hour SMA provides near-term support above the major 90.00 handle.
Weekly candlesticks tell an incredibly bullishly overbought story, with the NZD/JPY trading into eight-year highs as the Kiwi attempts to take a run at 92.00, a level the pair hasn’t seen since April of 2015.
New Zealand Dollar price today
The table below shows the percentage change of New Zealand Dollar (NZD) against listed major currencies today. New Zealand Dollar was the strongest against the Japanese Yen.
| USD | EUR | GBP | CAD | AUD | JPY | NZD | CHF | |
| USD | -0.16% | -0.37% | 0.04% | -0.24% | 0.05% | -0.44% | 0.03% | |
| EUR | 0.17% | -0.20% | 0.20% | -0.09% | 0.21% | -0.27% | 0.20% | |
| GBP | 0.35% | 0.19% | 0.39% | 0.11% | 0.41% | -0.08% | 0.39% | |
| CAD | -0.04% | -0.20% | -0.40% | -0.28% | 0.02% | -0.47% | -0.01% | |
| AUD | 0.26% | 0.07% | -0.13% | 0.27% | 0.29% | -0.20% | 0.26% | |
| JPY | -0.05% | -0.23% | -0.41% | -0.01% | -0.29% | -0.49% | -0.03% | |
| NZD | 0.43% | 0.27% | 0.08% | 0.46% | 0.20% | 0.49% | 0.47% | |
| CHF | -0.03% | -0.20% | -0.39% | 0.01% | -0.28% | 0.02% | -0.47% |
The heat map shows percentage changes of major currencies against each other. The base currency is picked from the left column, while the quote currency is picked from the top row. For example, if you pick the Euro from the left column and move along the horizontal line to the Japanese Yen, the percentage change displayed in the box will represent EUR (base)/JPY (quote).
NZD/JPY Hourly Chart
NZD/JPY Daily Chart

NZD/JPY Weekly Chart

Read the full article here

