GOLD PRICE (XAU/USD), AUD/USD FORECAST:
- Gold prices climb and challenge technical resistance on the back of falling U.S. yields and U.S. dollar softness
- AUD/USD also pushes higher, breaking above its 200-day simple moving average
- This article looks at key technical levels to watch on XAU/USD and AUD/USD this week
Most Read: US Dollar Forecast – PCE, Powell to Set Market Tone, Setups on EUR/USD, USD/JPY
Trade Smarter – Sign up for the DailyFX Newsletter
Receive timely and compelling market commentary from the DailyFX team
Subscribe to Newsletter
GOLD PRICE TECHNICAL ANALYSIS
Gold prices climbed on Monday, buoyed by the drop in U.S. yields and the U.S. dollar’s softness. With recent performance in mind, XAU/USD has risen more than 8% since October, firmly eclipsing its 200-day simple moving average and ascending beyond the psychological $2,000 level – two technical signals that have strengthened the metal’s constructive bias.
For stronger conviction in the bullish thesis and to validate the potential for further upward momentum, a clear and decisive move above $2,010/$2,015 is required – a major resistance zone that has consistently thwarted advances since the beginning of the year. While clearing this hurdle might pose a challenge for bulls, a breakout could catalyze a rally towards $2,060, followed by $2,085, May’s high.
In the event that gold gets rejected to the downside from its current position, the asset might trend towards support spanning from $1,980 to $1,975. Prices could potentially stabilize in this area on a bearish reversal, but a push below this floor could lead to a retreat towards the 200-day simple moving average situated around the $1,950 mark. Beneath this threshold, attention might refocus on $1,937.
Acquire the knowledge needed for maintaining trading consistency. Grab your “How to Trade Gold” guide for invaluable insights and tips!
Recommended by Diego Colman
How to Trade Gold
GOLD PRICE TECHNICAL CHART
Gold Price Chart Created Using TradingView
AUD/USD TECHNICAL ANALYSIS
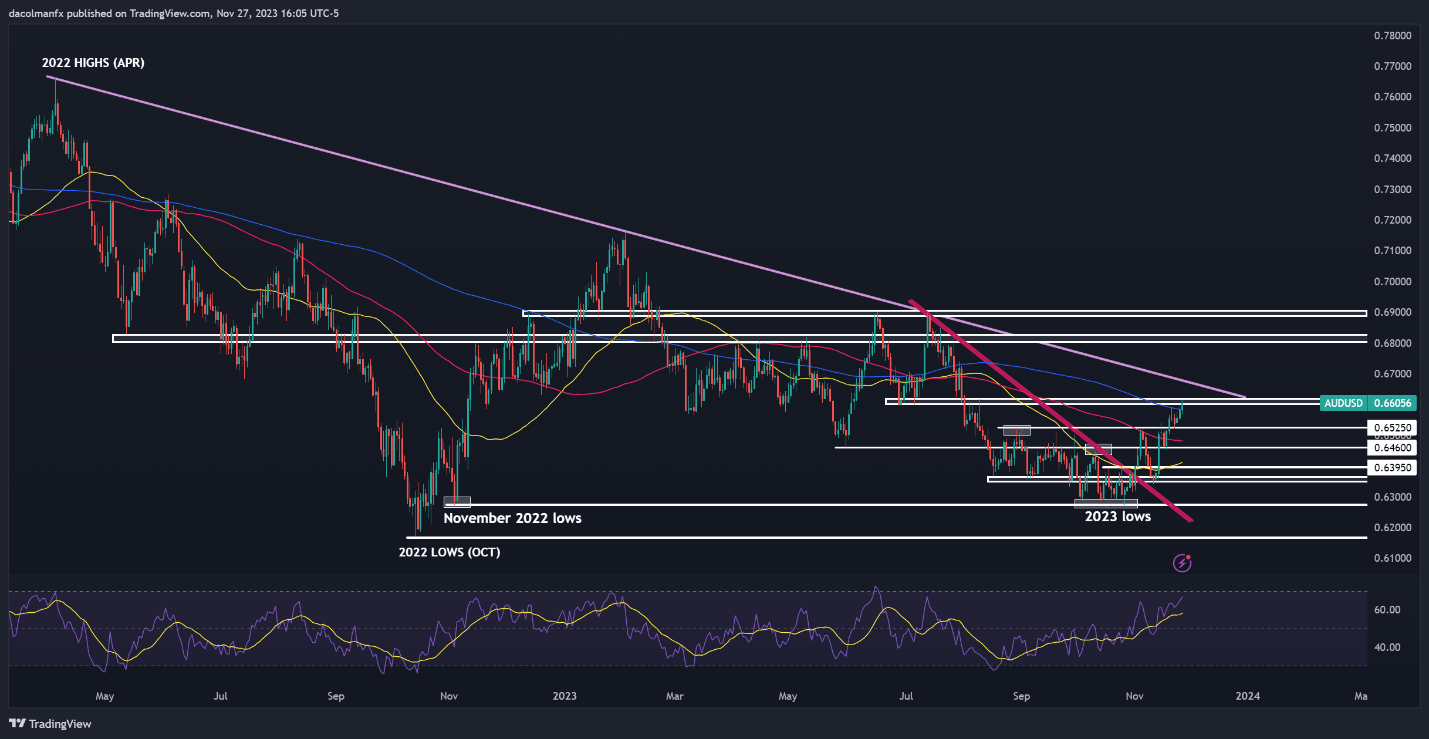
AUD/USD trekked upwards at the start of the new week, climbing above its 200-day simple moving average and coming within a whisker of taking out technical resistance located in the 0.6600-0.6620 band. With the RSI indicator approaching overbought territory, the recent rally could soon run out of steam, but a move above 0.6600-0.6620 could breathe new life into the pair and reinvigorate the bulls, propelling prices towards trendline resistance at 0.6670. On further strength, we may see a move towards 0.6815.
On the other hand, if market sentiment shifts in favor of sellers and AUD/USD takes a turn to the downside, primary support looms at 0.6525, but further losses could be in store on a push below this threshold, with the next downside target corresponding to the 100-day simple moving average, followed by 0.6460. It is of utmost importance for the bulls to robustly defend this floor; any failure to do so could catalyze a pullback towards 0.6395.
If you’re wondering what’s in store for the Australian dollar in the coming months, grab a free copy of the Aussie’s fundamental and technical trading guide.
| Change in | Longs | Shorts | OI |
| Daily | 8% | 1% | 5% |
| Weekly | -3% | 4% | 0% |
AUD/USD TECHNICAL CHART

AUD/USD Chart Created Using TradingView
Read the full article here

